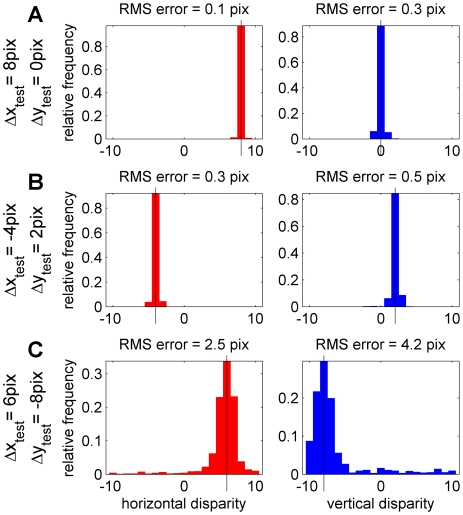
Figure 9. Results of estimating 2D stimulus disparity from the 1D disparity encoding population.
Each panel shows the distribution of the estimated disparity component (left column, red: horizontal disparity; right column, blue: vertical disparity). The rows show three different test disparities (Δxtest,Δytest), as indicated by the black vertical lines in each column. In each case, 1000 images with the specified test disparity were generated, and their 2D disparity was estimated as being the value of (Δxdec,Δydec) which gave the best match between the population activity Rtest(θ,f,Δφ, Δxenc) evoked by the test image, and the stored W(θ,f,Δφ,Δxenc;Δxdec,Δydec), as in Figure 8. The root-mean-squared error between the estimated disparity and the correct value is indicated at the top of each panel. Matlab code: The disparity estimates were obtained with Protocol S7, and the figure was generated with Protocol S8.

