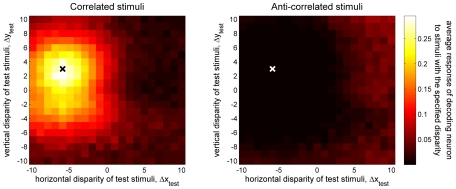
Figure 10. Disparity tuning surface for the disparity decoder tuned to Δxstim = −6 and Δystim = 3, indicated by the cross in each panel.
The color of each pixel in the plot shows the mean response, <P(Δxstim,Δystim)>, averaged over 40 test stimuli with the disparity (Δxtest,Δytest) specified by that pixel's position on the horizontal and vertical axes. A: for correlated stimuli. B: for anti-correlated stimuli. The same colorscale is used in both panels. Matlab code: The results were generated by Protocol S9 and the figure was plotted by Protocol S10.

