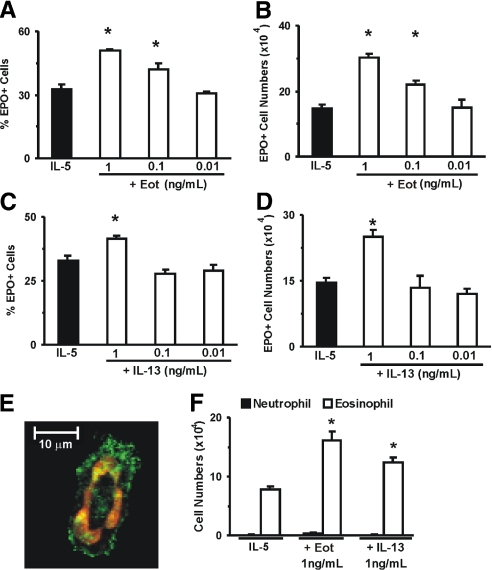
Figure 2.
Effect of eotaxin and IL-13 on IL-5-induced eosinophil differentiation. Data (mean±sem, n=3) are the percent EPO+ cells (A and C), the numbers of EPO+ cells (B and D), or the numbers of Giemsa-stained neutrophils and eosinophils (F) present by Day 7 in 1 mL liquid cultures, established with IL-5 (1 ng/ml), alone or in association with the indicated concentrations of eotaxin (A and B) or IL-13 (C and D). *, P < 0.05, for the differences between the indicated points and the respective IL-5 (negative) controls. Photomicrograph under confocal microscopy (E, ×630 original magnification, representative of three experiments) illustrates typical morphology of eosinophils in liquid culture following immunostaining for CCR3 (green) and nuclear staining with ToPro3 (red) [32].

