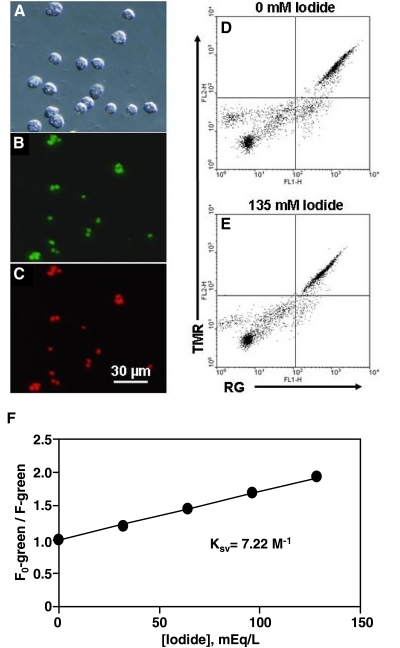
Figure 4.
Zymosan-conjugated fluorescent probe for sensing iodide levels. (A–C) Microscopic images of the iodide-specific probe in human neutrophils. Phase-contrast image of RG-TMR-zymosan particles in human neutrophils 15 min after ingestion (A). The corresponding RG fluorescence and TMR fluorescence images (B and C). (D–F) Two-color flow cytometric analysis of the RG-TMR-zymosan probe in neutrophils in response to extracellular iodide changes. The green RG fluorescence [FL1-height (FL1-H)] and the red TMR fluorescence (FL2-H) were gated electronically on the neutrophil population, as defined by forward- and 90° light-scatter. A flow cytometric dot plot shows the MCF change of the probe in the isoosmotic high potassium Ringer’s calibration buffer containing 0 mM (D) or 135 mM (E) iodide and also containing 10 μM tributyl tin acetate and 7 μM nigericin as ionophores. (F) The calibration curve was generated using a series of defined calibration buffers with varied iodide concentrations. The data were plotted as the ratio of the MCF of RG in iodide-free Ringer’s buffer (F0) to that of RG of the same cell population measured in the presence of a given iodide concentration. The Ksv was determined by linear regression analysis to be 7.22 M–1, according to the equation F0/F = 1 – Ksv[I−], where [I−] is the molar concentration of iodide.

