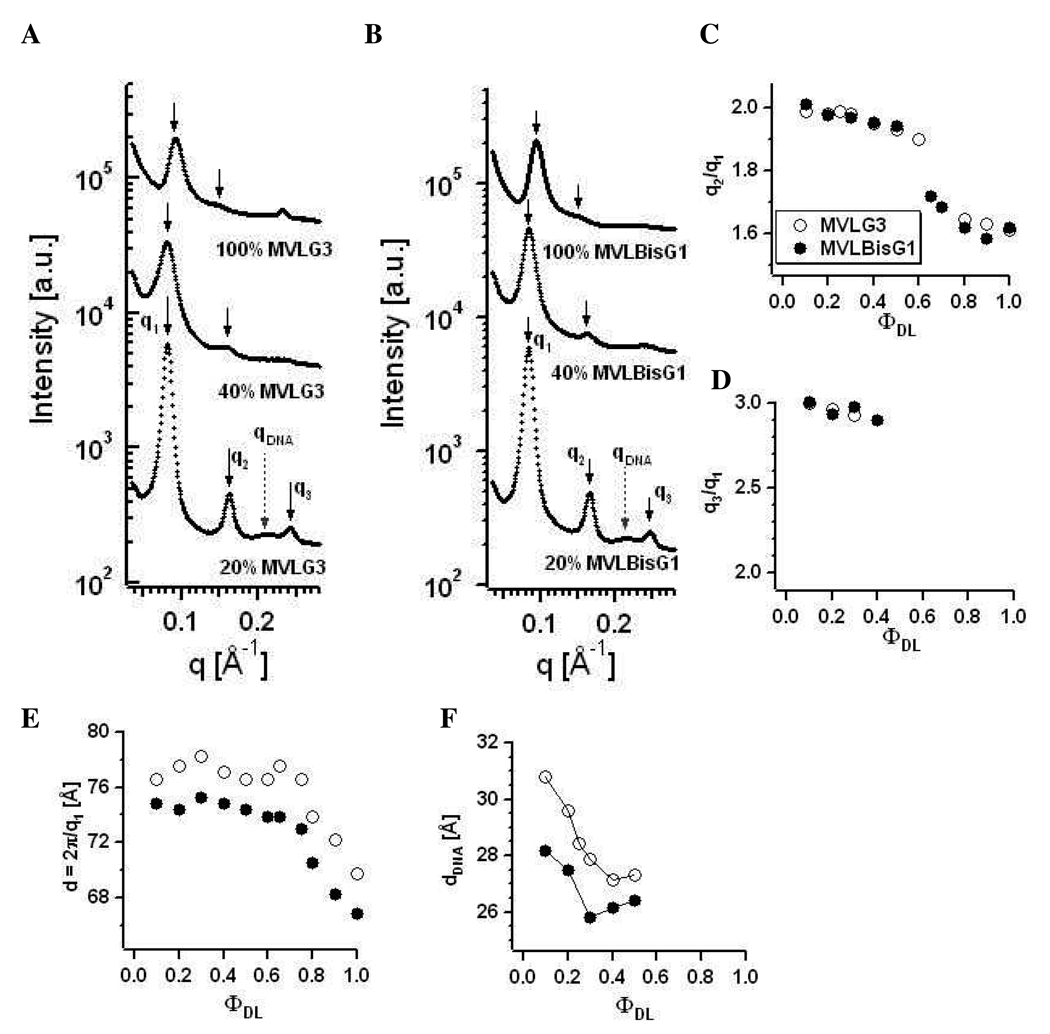
Figure 12.
X-ray diffraction data for (A) MVLG3/DOPC–DNA complexes and (B) MVLBisG1/DOPC–DNA complexes at ΦDL = 0.2, 0.4, and 1. The diffraction peaks are marked as in Figure 7. (C) Ratio of the first and second order diffraction peaks, q2/q1, and (D) ratio of the first and third order diffraction peaks, q3/q1, plotted as a function of ΦDL. (E) The spacing d = 2π/q1 as a function of ΦDL. (F) Plot of dDNA as a function of increasing ΦDL in lamellar complexes.

