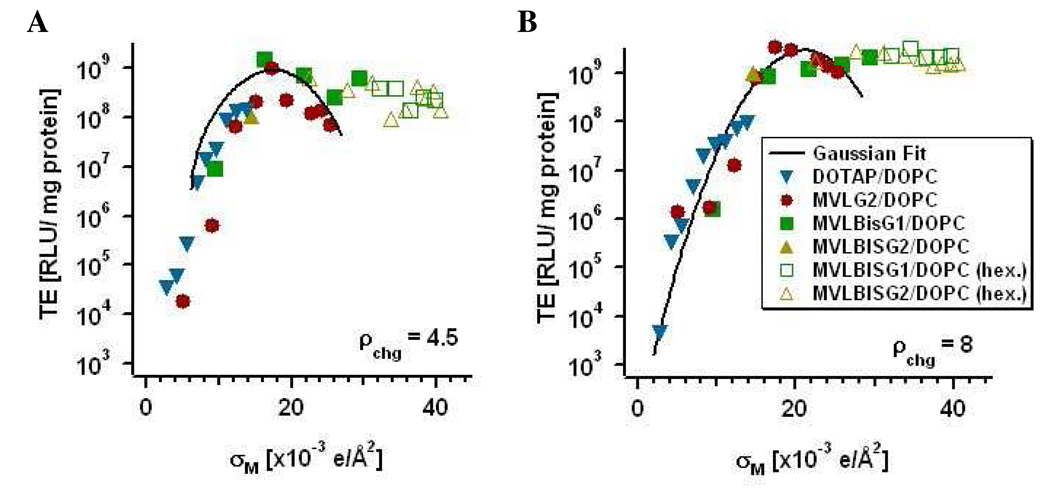
Figure 6.
TE of DL/DOPC–DNA complexes containing MVLG2, MVLBisG1 or MVLBisG2 plotted as a function of σM for two different values of ρchg. (A) TE at ρchg = 4.5 and (B) TE at ρchg = 8. The solid line represents the universal TE curve22. The solid symbols represent DL/DOPC–DNA complexes in the lamellar phase, while empty symbols correspond to DL/DOPC–DNA complexes in hexagonal phases.

