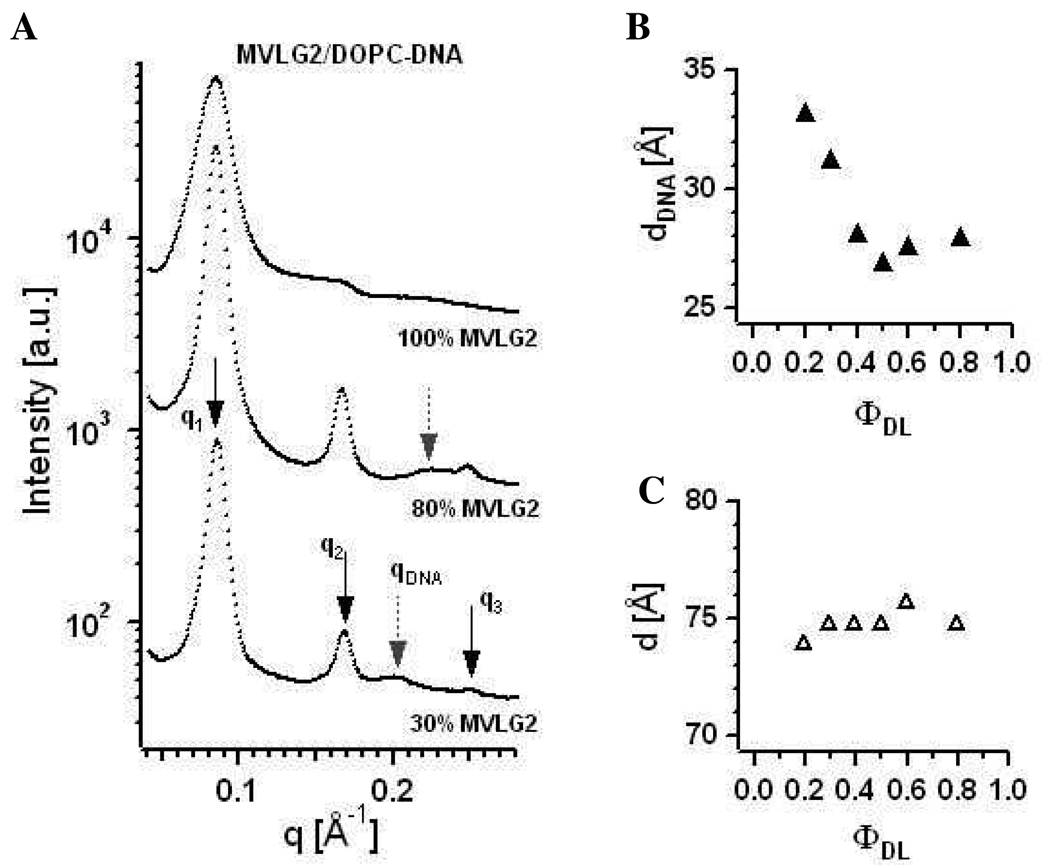
Figure 7.
(A) X-ray diffraction data for MVLG2/DOPC–DNA complexes at ΦMVLG2 = 0.3, 0.8, and 1. First, second and third order of the lamellar peak are marked by q1, q2, and q3, respectively. Grey dashed arrows point to the DNA peak at qDNA. (B) Plot of dDNA as a function of increasing ΦMVLG2. For ΦMVLG2 = 1, no DNA correlation peak is observed. (C) Plot of the intralamellar spacing d of MVLG2/DOPC–DNA complexes as a function of increasing ΦMVLG2.

