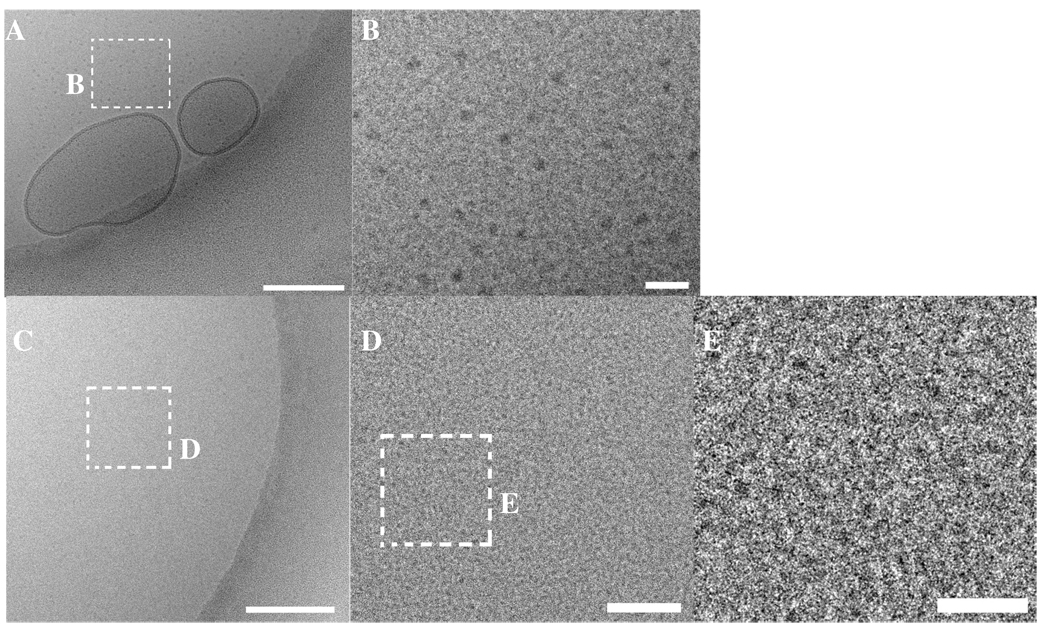
Figure 9.
(A) Cryo-TEM image of a MVLBisG2/DOPC lipid mixture at ΦDL = 0.75 in the absence of DNA, showing a coexistence of lipid vesicles and micelles. (B) An enlarged inset from A displaying the micelles in greater detail. (C) Cryo-TEM image of a MVLBisG2/DOPC lipid mixture at ΦDL = 1 in the absence of DNA. No vesicles are observed. (D) An enlargement of the area marked in C demonstrates the presence of the micelles (black dots). (E) An inset area from D showing the micelles (black) in greater detail. The scale bar represents 200 nm in A and C, 50 nm in D and 20 nm in B and E.

