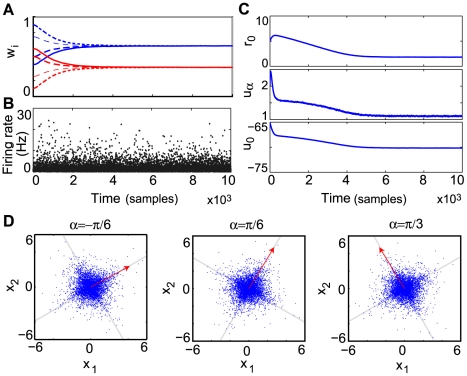
Figure 2. A demixing problem: two rotated Laplace directions.
(A) Evolution of the weights ( in blue,
  in red) for different initial conditions, with
  , and
, and  weight normalization. (B) Evolution of the instantaneous firing rate
  , sampled each 1000 ms, for the initial weights
  ,
,  . (C) Corresponding changes in transfer function parameters, with
  in Hz and
  and
and  in mV. (D) Final weight vector for different rotation angles
  (in red). In the first example, normalization was done by
  (the estimated rotation angle is
  , instead of the actual value 0.5236); for the others
  was used. In all cases the final weight vector was scaled by a factor of 5, to improve visibility.

