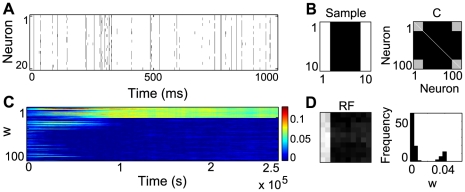
Figure 5. Bars in a correlation-based encoding.
(A) Example of 20 spike trains with  . (B) A sample containing two 2-pixel wide bars and the corresponding covariance matrix used for its encoding. (C) Evolution of the weights during learning. (D) Final receptive field and corresponding weights histogram.

