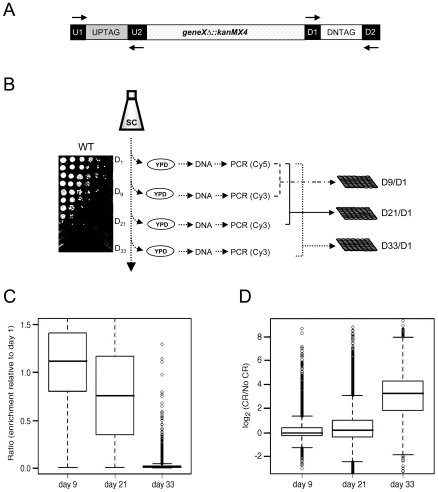
Figure 1. Microarray-based screen for chronological longevity factors.
(A) Schematic representation of the UP and DOWN tags flanking KanMX. Universal primer sequences (U1/U2 and D1/D2) flank the UP and DOWN tags. (B) Experimental flow of the screen. Aliquots were removed from SC cultures of the pooled YKO population at days 1, 9, 21, and 33, and spread onto YPD plates to allow growth of survivors. A typical BY4741 CLS time course in 2% glucose (NR) is shown. The TAGs were PCR amplified from genomic DNA and fluorescently labeled with either Cy5 (day 1) or Cy3 (days 9, 21, and 33). The day 1 TAGs were co-hybridized with day 9, 21, or 33 TAGs onto the microarray to generate the abundance ratio for each mutant at that particular day (D9/D1, D21/D1 and D33/D1). (C) Box plot of the mutant abundance ratios within the aging population at days 9, 21, and 33 from the NR medium. (D) Box plot showing the general increase in mutant viability within the aging population for CR medium compared to NR medium.

