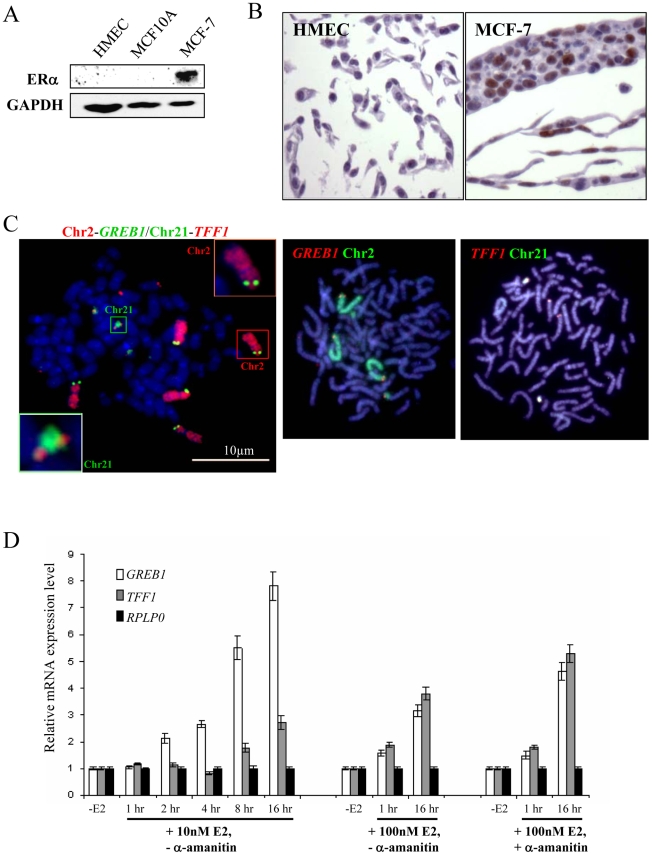
Figure 2. Expression and genomic arrangement of TFF1 and GREB1 in breast epithelial cells and MCF-7 breast cancer cells.
(A) Western blot to detect protein expression of ERα and GAPDH in total cell lysate prepared from HMEC, MCF10A and MCF-7 cells. (B) Immunohistochemical staining of HMEC and MCF-7 cells with antibody that detects ERα (brown). (C) FISH with probes for TFF1 and GREB1, and paints for chromosomes 2 and 21, on metaphase chromosomes prepared from MCF-7 cells. Bars, 10 µm. (D) Real-time qPCR analysis to detect the relative expression levels of GREB1, TFF1 and a RPLP0 control prepared from MCF-7 cells grown without E2 (-E2) and during 16 hr time courses in the presence of either 10 nM or 100 nM E2. Cells with (+) and without (−) pre-treatment with 2.5 nM α–amanitin were also examined.

