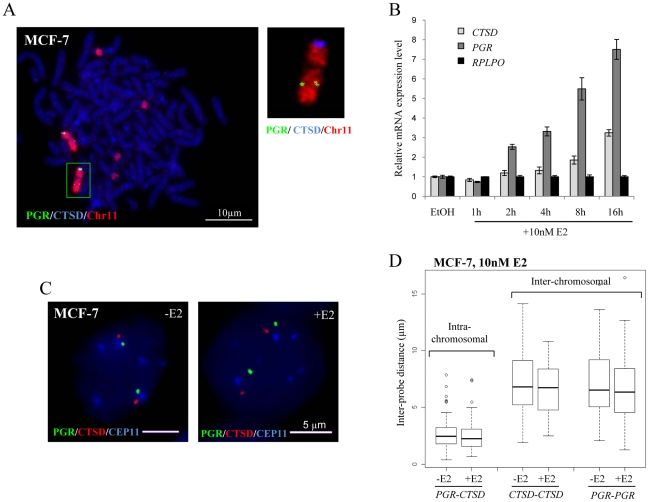
Figure 4. Localisation, expression, and nuclear organisation of PGR and CTSD in MCF-7 cells.
(A) FISH with probes for CTSD (blue) and PGR (green) and paint for chromosome 11 (red) on metaphase chromosome spreads of MCF-7 cells. Scale bars = 10 µm. (B) Real-time qPCR analysis to detect the relative expression levels of PGR, CTSD and a RPLP0 control prepared from MCF-7 cells grown without E2 (-E2) and during 16 hr time courses in the presence of 10 nM E2. (C) 3D Interphase FISH with probes for CTSD(red), PGR(green) and the centromere of chromosome 11 CEP11 (blue) on nuclei of MCF-7 cells grown in the absence of estrogen (-E2) and 3 hrs after the addition of 10 nM E2 (+E2). Nuclei were counterstained with DAPI (blue). Scale bars = 5 µm. (D) Box plots show inter- and intra-chromosomal distances (µm) between PGR and CTSD alleles, as measured by 3D FISH in nuclei of MCF-7 cells grown in the absence of E2 (-E2) and 3 hrs after the addition of 10 nM E2. Asterisks indicate data points beyond the 95th percentile. N = 50 cells.

