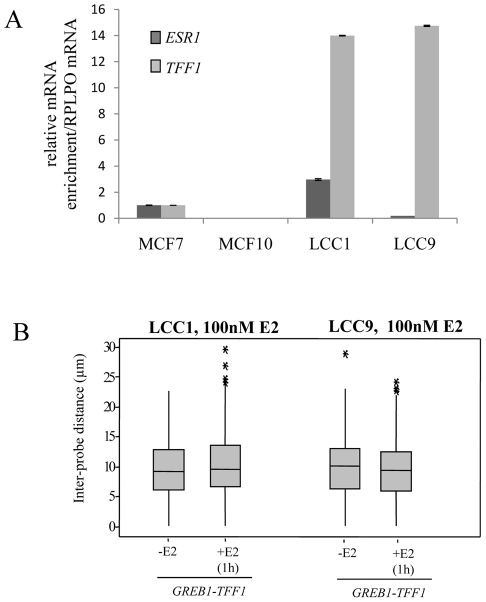
Figure 5. TFF1 and GREB1 nuclear organisation in LCC1 and LCC9 cells.
(A) Real-time qPCR analysis to detect the relative expression levels of ERα (ESR1) and TFF1 prepared from MCF-7, MCF10A, LCC1 and LCC9 cells grown in phenol red containing DMEM. (B) Box plots showing inter-probe distances (d) between heterologous TFF1 and GREB1 alleles, as measured by 2D FISH in nuclei of LCC1 or LCC9 cells grown in the absence of E2 (-E2) or after 1 hr in the presence of 100 nM E2. Asterisks indicate data points beyond the 95th percentile. N = 50 cells.

