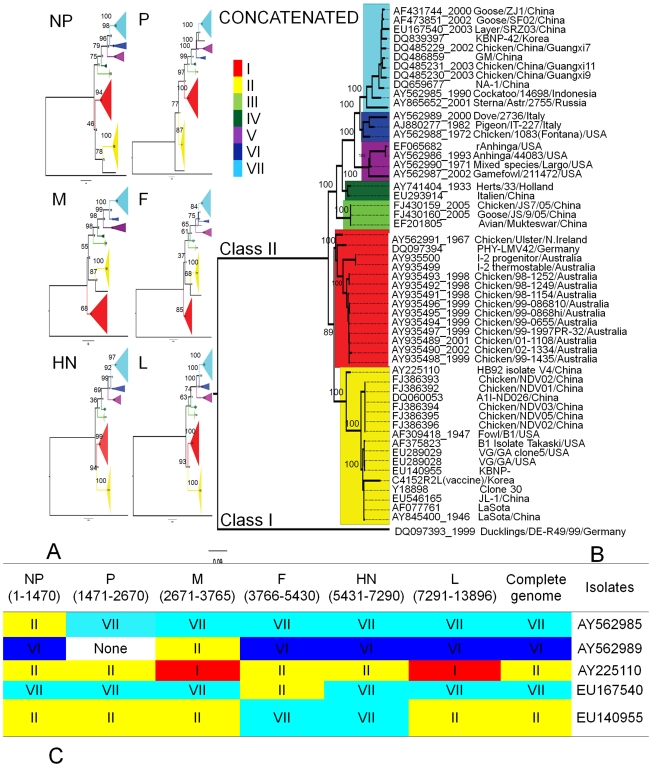
Figure 1. Maximum likelihood trees showing phylogenetic relationships among different genotypes.
A total of 54 isolates representing seven different genotypes were used in the phylogenetic reconstruction. (A) Genotype topology based on each of the six aPMV-1 genes. Area of the triangle is proportional to the number of isolates within the genotype. (B) ML tree inferred from the concatenated gene sequences of the 54 isolates. Genbank accession number is shown for each isolate. Bootstrap supports are given at the base of the nodes. All trees are rooted with strain DQ097393, which belongs to class I aPMV-1. The trees are midpoint rooted for clarity. (C) Diagram of genotype affiliation of each gene for isolates that showed topological incongruence in different gene trees. Genotypes I, II, III, IV, V, VI, and VII, are coded with red, yellow, lime-green, dark-green, purple, cyan, and blue colors, respectively.

