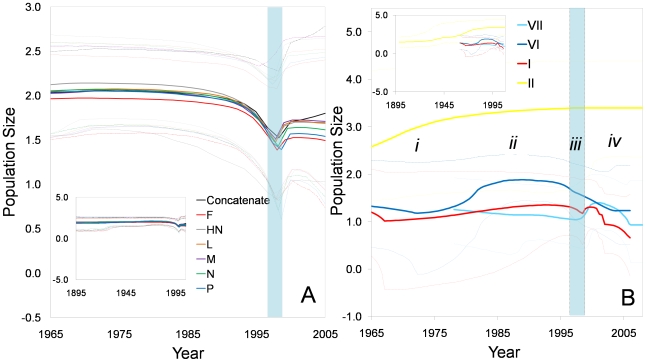
Figure 5. Bayesian skyline plots (BSP) depicting effective population size of class II aPMV-1 over time.
Effective population size estimates are expressed on a logarithmic scale (y axis). Solid lines denote the median estimates and the dotted lines give the 95% HPD intervals of the estimates. The shaded light blue region indicates a population bottleneck. BSP based on (A) individual genes and concatenated genome sequences. The figure highlights the interval from 1965–2005; the entire estimate is displayed in the inset. The dark blue, red, pink, blue, light green, light blue and green lines are the estimates based on the concatenated sequence, NP, P, M, F, HN and L genes, respectively; (B) individual genotypes (I, II, VI, and VII) using complete F gene sequence. Symbols i-iv represent four phases of aPMV-1 history (described in detail in text). Genotype I, II, VI and VII, are coded by red, yellow, dark blue, and light blue lines, respectively.

