


Figure 3.
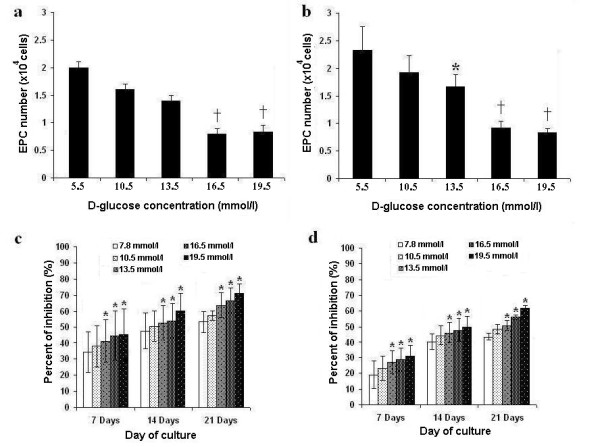
Number and proliferative capacity of EPCs cultured in hyperglycemic conditions. a and b: Effect of various glucose concentrations on the number of cultured EPCs isolated from healthy controls (a) and diabetes (b) after 21 days of culture. c and d: Effect of various glucose concentrations on the proliferative capacity of cultured EPCs isolated from diabetes (c) and healthy controls (d) as determined by MTT assay. * p < 0.05, † p < 0.01 versus control.