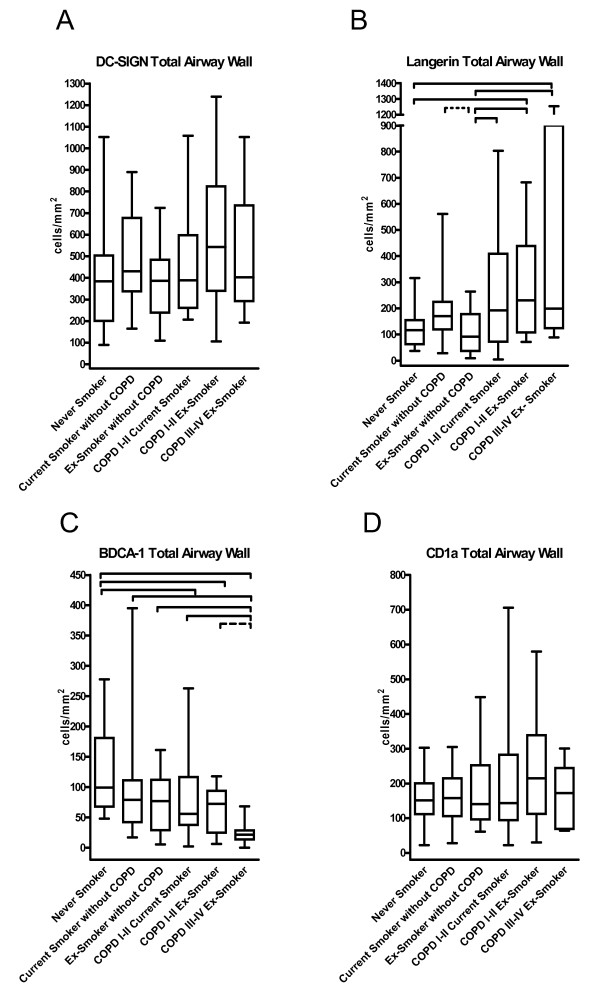
Figure 6.
Box and whisker plots: Quantification of DC-SIGN positive (interstitial-type) dendritic cells (A), Langerin positive (Langerhans-type) dendritic cells (B), BDCA-1 positive myeloid dendritic cells (C) and CD1a positive dendritic cells (D) in small airways of never smokers, current smokers without COPD, ex-smokers without COPD, current smoking COPD patients GOLD I-II, ex-smoking COPD patients GOLD I-II and ex-smoking COPD patients GOLD stage III&IV. Data are presented as number of dendritic cells/area of total airway wall (cells/mm2). Significant differences between 2 groups (p values <0.05), generated by the Mann-Whitney-U test after analysis of variance are marked with a full line, p values between 0.05 and 0.08 are marked by a dashed line.

