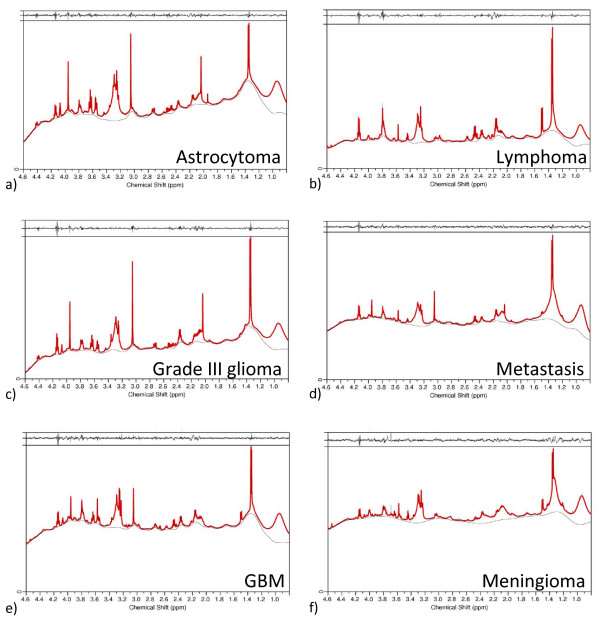
Figure 2.
LCModel fits of HRMAS spectra. LCModel was used to fit the simulated basis set to each HRMAS pulse acquire spectrum with water presaturation. The six examples given here are a) astrocytoma grade II, b) lymphoma, c) an anaplastic astrocytoma, d) metastasis, e) GBM and f) a meningioma. The red line shows the linear combination of the basis set, and the thin grey line is the base line determined by LCModel. The residual (the fit and the base line subtracted from the raw data) is shown in a narrow box at the top of each panel.

