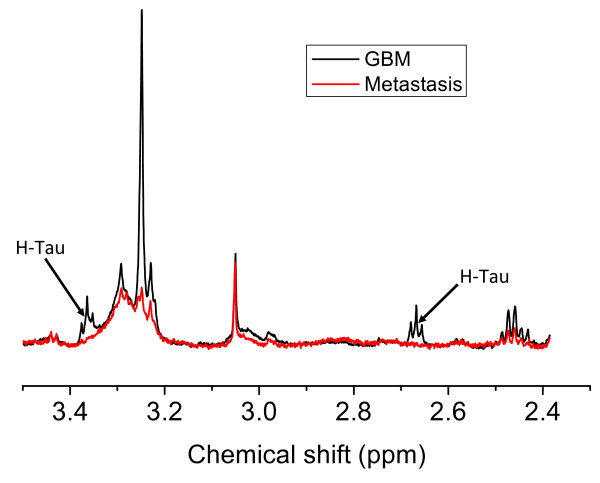
Figure 3.
Absence of h-Tau in metastases. This figure shows two pulse-acquire specta. The spectrum of a GBM shows the position of the two triplet resonances of h-Tau. The metastasis shows noise in these same regions of the spectrum despite LCModel fitting a small amount of h-Tau when quantifying this spectrum.

