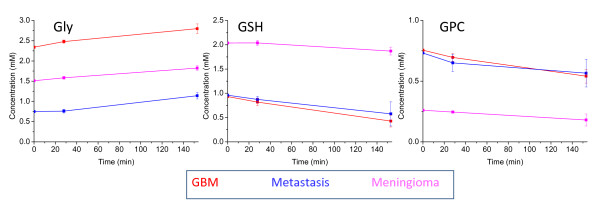
Figure 4.
Metabolite concentration changes over time under HRMAS experimental conditions. These three line graphs plot the change in mean metabolite concentration with time over the course of 28 minutes and 2 hours 33 minutes. Error bars show the standard error of the change in the mean. Changes are shown for Gly, GSH and GPC which have significant changes over 2 hours 33 minutes and the different tumour types in each plot are indicated by the colour key.

