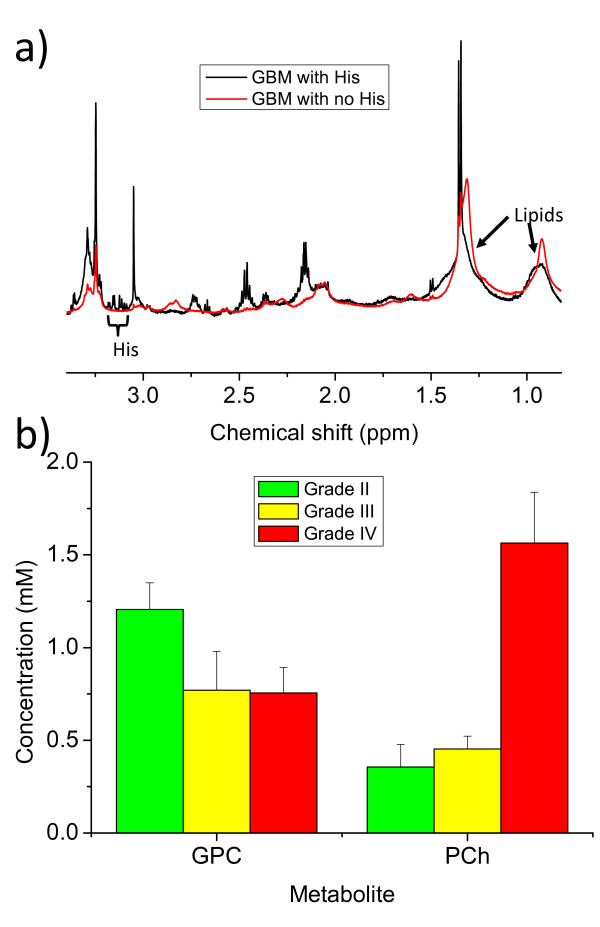
Figure 8.
Other metabolite differences between tumour types. This figure shows two pulse acquire spectra of GBM samples. The spectrum shown in black has clear His signals in the 3.2 - 3.1 ppm region. The spectrum in red has only noise in this region and generally lower small molecule metabolite signals but much higher lipid signals as indicated in the 1.3 ppm and 0.9 ppm regions. b) This bar chart plots the mean concentration of GPC and PCh, with error bars of the standard error of the mean, for three of the tumour groups: astrocytoma grade II, grade III gliomas and the (grade IV) GBMs.

