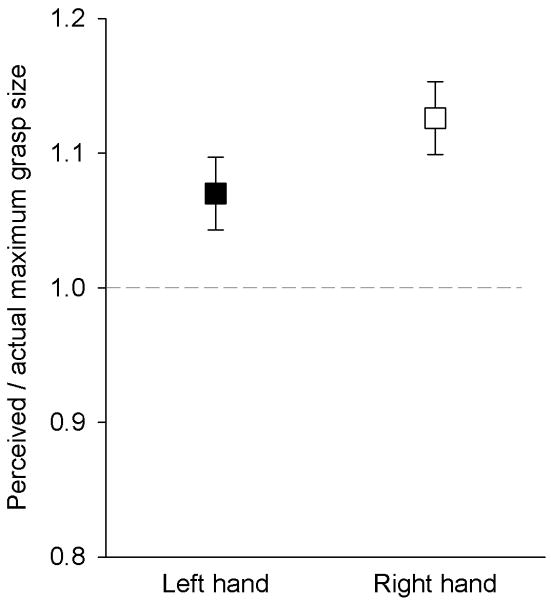
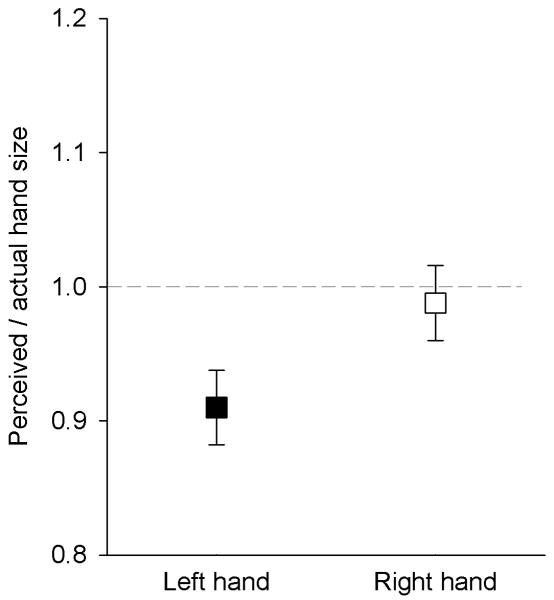
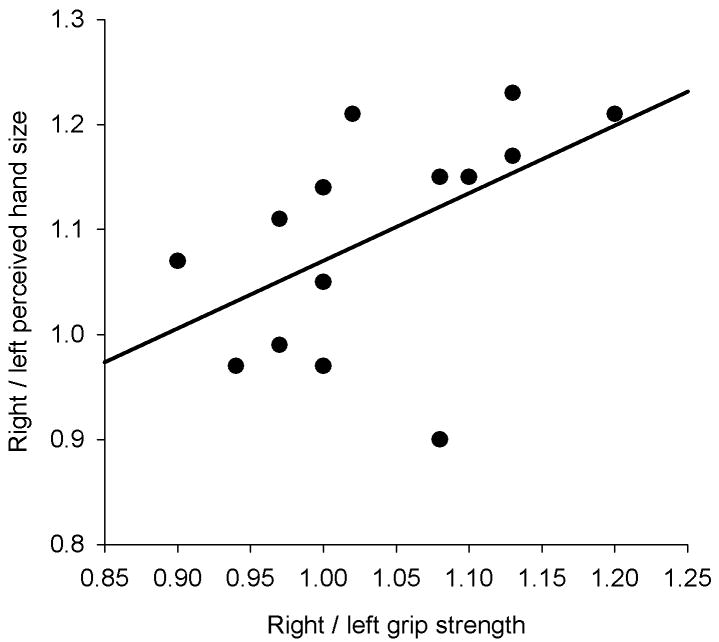
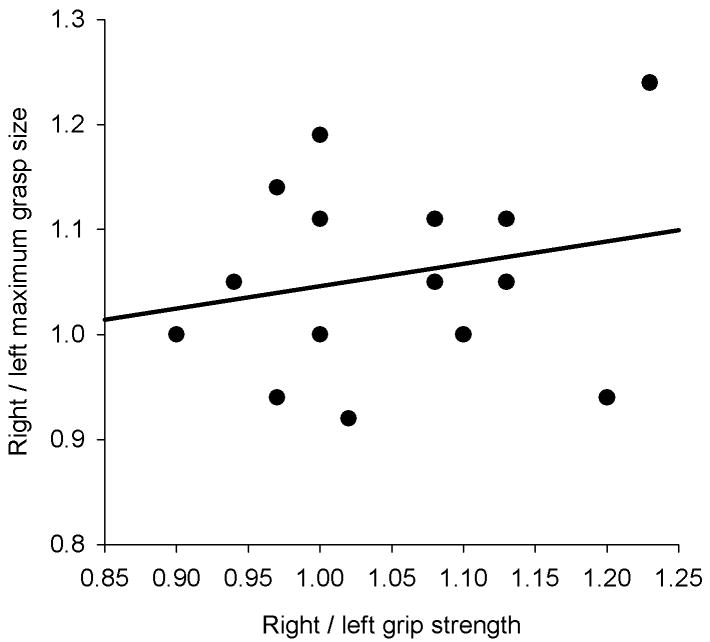
Fig. 4.
Results from Experiment 3: (a) the ratio of perceived grasping ability to actual grasping ability for each hand, (b) the ratio of perceived hand size to actual hand size for each hand, (c) the relationship between relative-strength ratio and left-right symmetry for perceived hand size, and (d) the relationship between relative-strength ratio and left-right symmetry for perceived maximum grasp size. All data are for right-handed individuals. Lines represent linear regressions of the data. Error bars represent 95% within-participants confidence intervals, calculated using the method in Loftus and Masson (1994).


