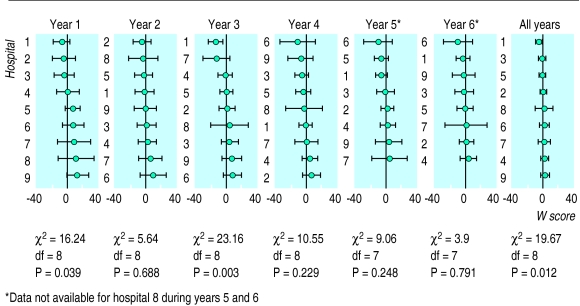
Figure 2.
Annual league tables of risk adjusted mortality in nine neonatal intensive care units for each year and for all years combined. Mortality is lower than expected when the W score and 95% confidence interval are both <0. Hospitals were ranked in descending order of apparent performance by W score. The 95% confidence intervals of the hospitals that apparently performed best and those that apparently performed worst overlapped for every year except year 3

