
Figure 2b:
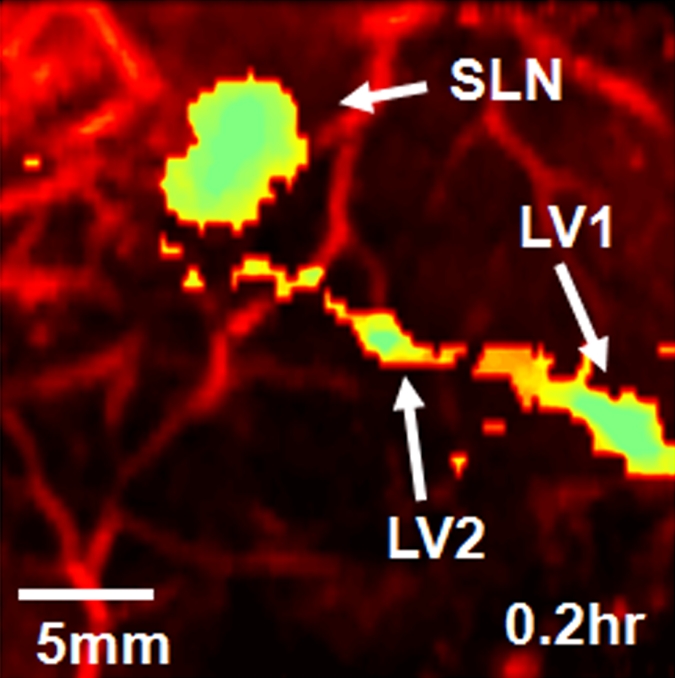
Volumetric photoacoustic imaging. (a) Control MAP image acquired before ICG injection in the axillary region. Blood vessels (BV) are seen. (b) Photoacoustic image acquired 0.2 hour after injection. Lymphatic vessels, as well as an SLN, are seen. (c) Three-dimensional photoacoustic image processed from the 0.7-hour postinjection data shown in Figure E1 (online). (d) Graph shows results of comparison of photoacoustic (PA) signals within the SLN and lymphatic vessels (LV) versus time before and after the injection in a given rat. The photoacoustic signals were normalized by the photoacoustic signals of adjacent blood vessels. (e) Graph shows results of statistical comparison of photoacoustic signal enhancement in the background (BG) (n = 5), SLN (n = 5), and lymphatic vessels (n = 4) at 0.2 and 1 hour after injection. The P values for the SLN and lymphatic vessels, respectively, were less than .002 and .001 at 0.2 hour after injection and less than .001 and .13 at 1 hour after injection. (f) Photographs of rat before dissection (top), axillary region after dissection (bottom left), and ICG-dyed lymph node (bottom right). a.u. = Arbitrary units (AU), error bars in d = standard deviation, error bars in e = standard error of the mean.