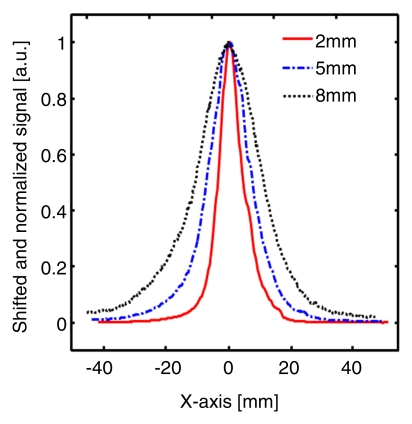
Figure 4d:
Comparison of spatial resolutions between photoacoustic and fluorescence images with increases in imaging depth increments. (a) Photoacoustic MAP (top row) and corresponding depth-resolved B-scan (bottom row) images of SLNs at three depths. (b) Graph shows results for three 1D profiles taken from along the dotted lines in the MAP images in a. (c) Fluorescence images of SLNs at three depths. (d) Graph shows results for three 1D profiles taken from along the dashed lines in c.

