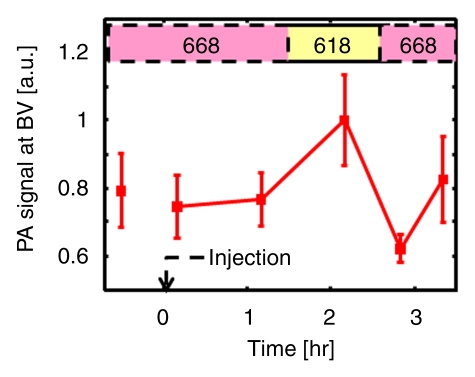
Figure 5e:
Spectroscopic photoacoustic images. (a) Image at 668 nm 0.2 hour after injection. (b) Image at 618 nm 2.2 hours after injection. (c) Image at 668 nm 2.8 hours after injection. (d) Graph shows comparison of spectroscopic photoacoustic (PA) signals within the SLN region over a period of time. (e) Graph shows comparison of spectroscopic photoacoustic signals within blood vessels (BV) over a period of time. LV = lymphatic vessel. Numbers in colored bar at top of d and e = wavelength in nanometers.

