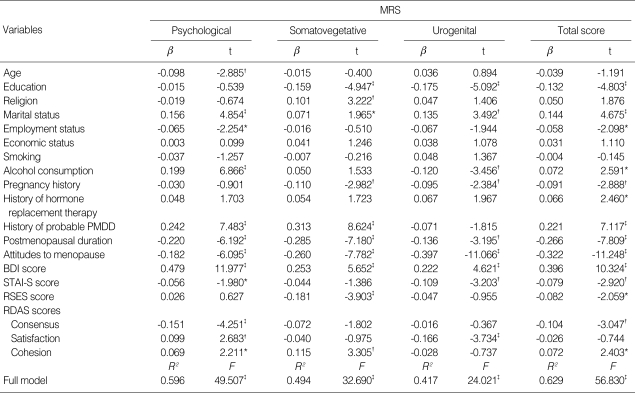
Table 4.
Relationships between the demographics, attitudes to menopause, the depressive and anxious symptoms, self-esteem, and dyadic adjustment to the dimensions of the MRS
Data are standardized regression coefficients (β), which indicate the relative magnitude of prediction for each independent variable. All independent variables were entered simultaneously into a multiple linear regression model, with the explained amount of variance (adjusted R2) for each menopause symptom rating dimension. In cases of categorical variables, dichotomous dummy variables were created by combining the categories, and these were entered into the regression analysis as follows: education (0=under middle school, 1=at least high school), religion (0=none, 1=believer), marital status (0=married, 1=divorced/separated or widowed/single), occupation (0=unemployed, 1=employed), economic status (0=monthly income under 3 million Korean won, 1=monthly income over 3 million Korean won), smoking (0=never, 1=currently or previously), alcohol consumption (0=never, 1=currently or previously), pregnancy history (0=no, 1=yes), history of hormone replacement therapy (0=no, 1=yes), and history of probable PMDD (0=no, 1=yes).
*P<0.05; †P<0.01; ‡P<0.001.
MRS, Menopause Rating Scale; PMDD, Premenstrual Dysphoric Disorder.

