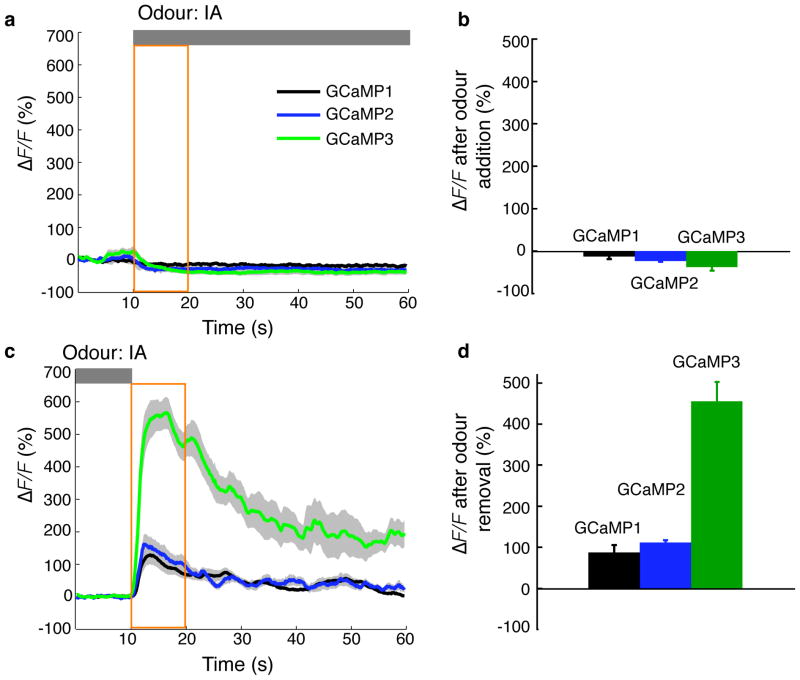
Figure 4. In vivo imaging of sensory-evoked Ca2+ transients with GCaMPs in C. elegans.
Odour-evoked responses of GCaMP1, GCaMP2 and GCaMP3 in C. elegans olfactory neurons. Transgenic worm lines expressing GCaMPs were imaged following an odour addition-removal sequence. (a,b) Upon odour presentation, GCaMP3 and GCaMP2 showed a similar decrease in fluorescence intensity. (c,d) Upon odour removal, GCaMP3 showed a 4- to 5-fold increase of fluorescence response compared to GCaMP2 and GCaMP1. Grey bars denote odour presence. Yellow intervals were analyzed in b and d. Grey shading of each trace and error bars indicate standard error of the mean (S.E.M., n = 12 animals for each genotype).

