
Fig. 4. BioMAP Analysis of PI3K Inhibitors.
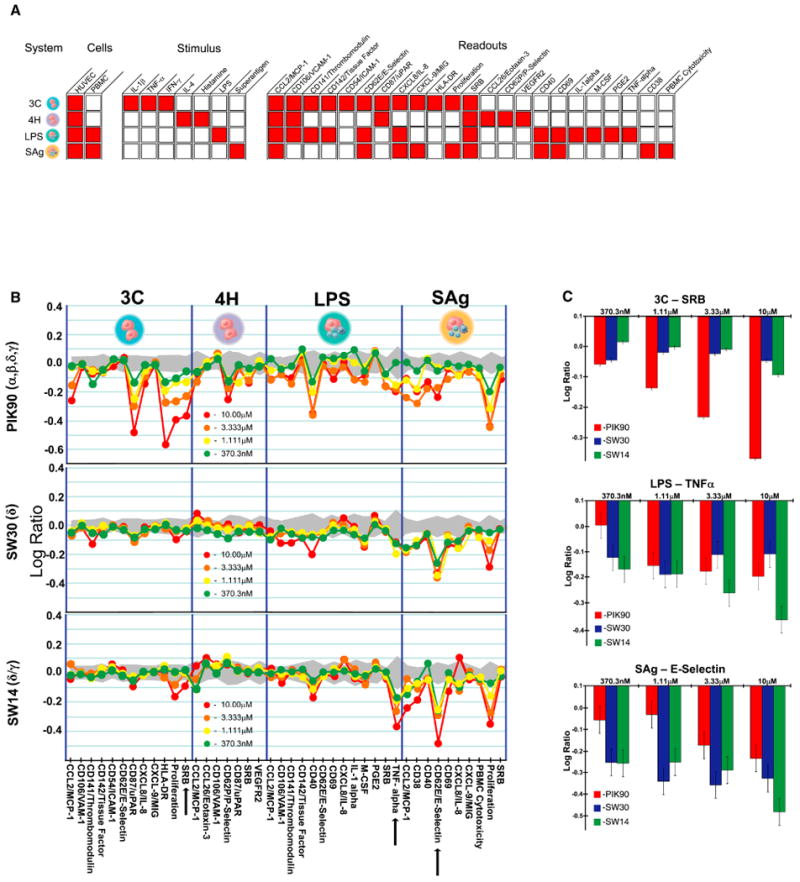
A. BioMAP Systems details.
B. BioMAP profiles for PIK90 (pan-PI3K) (top), SW30 (PI3Kδ) (middle), and SW14 (PI3Kδ/γ) (bottom). Red dots represent a 10μM dose, orange corresponds to 3.3μM, yellow represents 1.1μM and green represents 370nM. Levels of proteins were measured by ELISA and presented as log expression ratios [log10(parameter value with inhibitor/parameter value of 0.1% DMSO)]. The gray area represents the 95% prediction interval of the 0.1% DMSO data. Arrows indicate readouts that are expanded in 4C for closer inspection.
C. Log Expression Ratios of selected readouts that show divergence between pan-PI3K inhibition and selective PI3K inhibition