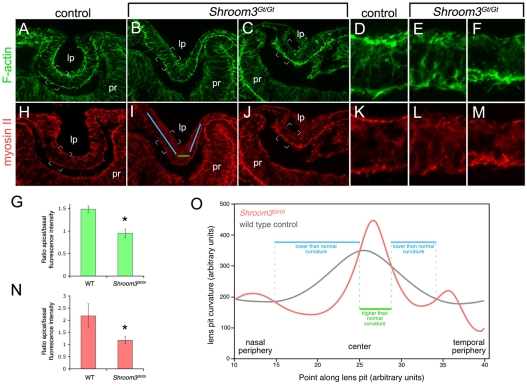
Fig. 2.
F-actin and myosin II are mislocalized in the lens pits of Shroom3 mutant embryos. (A-F,H-M) Cryosectioned E10.5 lens pits from control or Shroom3Gt/Gt mutant mice labeled with phalloidin to visualize F-actin (A-F) or with an antibody specific to myosin II (H-M). D-F and K-M are magnifications of the indicated regions of A-C and H-J, respectively. The blue and green lines in I refer to regions of distinct curvature in control and Shroom3Gt/Gt lens pit as quantified in O. lp, lens pit; pr, presumptive retina. (G,N) Quantification of F-actin (G) and myosin II (N) labeling intensity along the apical and basal surfaces of the lens pit in E10.5 control and Shroom3Gt/Gt embryos. *, P<0.05 by Student's t-test. (O) Quantification of rate of change of curvature along the basal surface of control (gray line) and Shroom3Gt/Gt (red line) lens pits. Regions where the mutant shows lower than normal curvature (blue lines) or higher than normal curvature (green line) are indicated.

