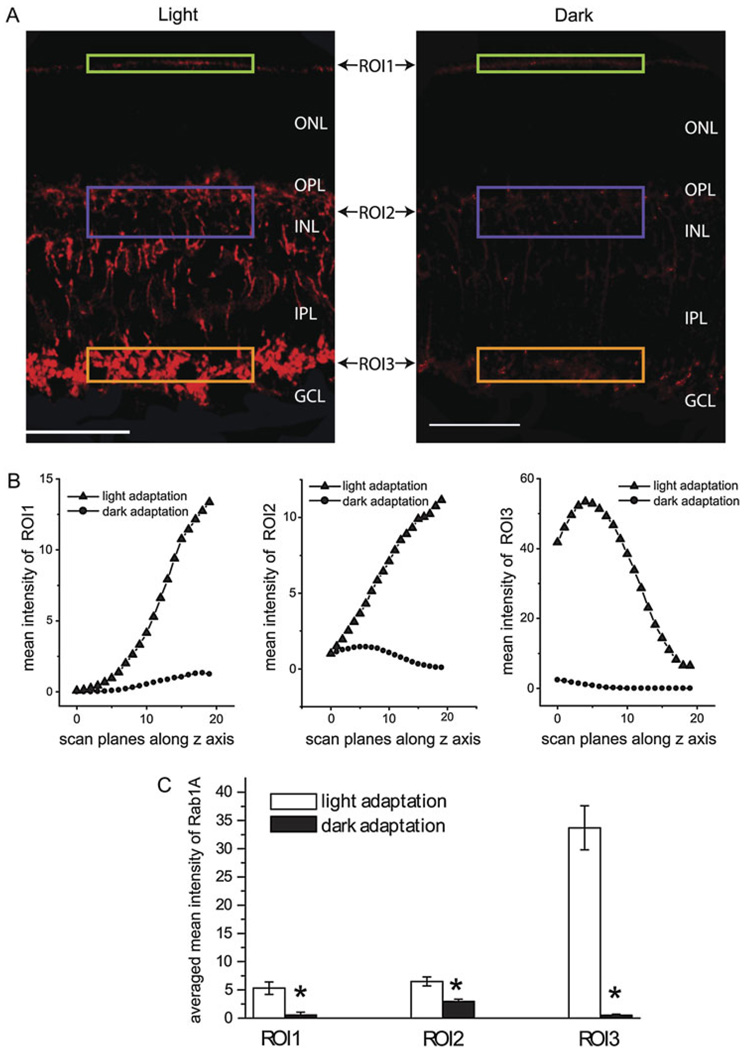
Fig. 6.
Rab1 expression in the mouse retinas was enhanced under the light adaptation compared to that under dark adaptation. (A) Comparison of immunostaining with Rab1 antibodies in the light-adapted (left panel) and dark-adapted (right panel) retinas obtained under the identical procedures. From each immunostain, three ROIs, ROI1 (green box), ROI2 (blue box), and ROI3 (brown box), were selected in the outer border of the ONL, the INL, and the innermost of the IPL, respectively, to quantify the intensity of the immunolabeling with Rab1 antibodies. Scale bar: 50 µm. (B) The mean immunofluorescent intensities from the light- and dark-adapted retinas. For each ROI, 20 scan planes were taken at different depths. The mean fluorescent intensities from each scan plane were plotted as a function of its related depth. (C) The average of the mean immunofluorescent intensities of the 20 scan planes from the light- and dark-adapted retinas as shown in (B). *P < 0.05 versus light adaptation.

