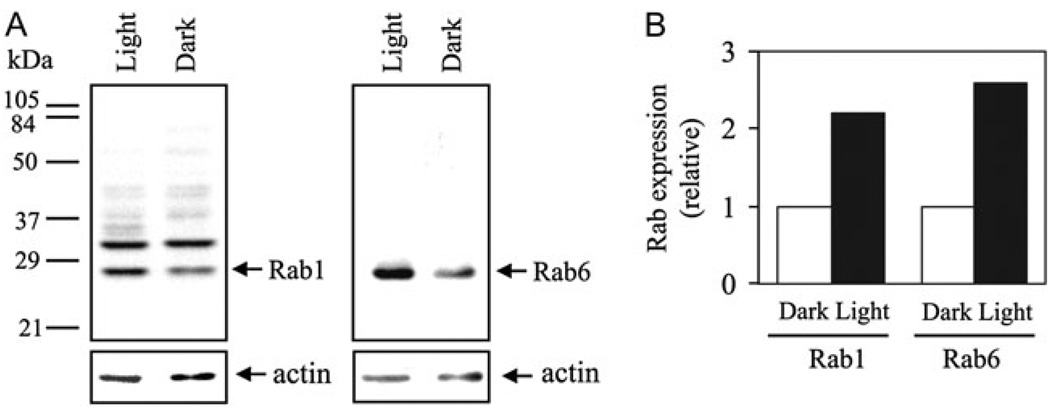
Fig. 8.
Western blot analysis of Rab1 and Rab6 expression in the light- and dark-adapted mouse retinas. (A) Representative blots showing that expression of Rab1 (left panel) and Rab6 (right panel) is increased in the light-adapted retinas (light) as compared to the dark-adapted retinas (dark). The numbers indicated on the left are molecular weights. After immunoblotting with anti-Rab antibodies, the blots were stripped and reprobed with anti-actin antibodies (lower panels), which serve as controls for equal protein loading. (B) Quantitative data expressed as fold increase over the dark-adapted retinas. Similar results were obtained in three independent experiments.

