Abstract
Flavin-containing monooxigenases (FMOs) are a polymorphic family of drug and pesticide metabolizing enzymes, found in the smooth endoplasmatic reticulum that catalyze the oxidation of soft nucleophilic heteroatom substances to their respective oxides. Previous studies in euryhaline fishes have indicated induction of FMO expression and activity in vivo under hyperosmotic conditions. In this study we evaluated the effect of hypersaline conditions in rat kidney. Male Sprague–Dawley rats were injected intraperitoneal with 3.5 M NaCl at a doses ranging from 0.3 cm3/100 g to 0.6 cm3/100 g in two separate treatments. Three hours after injection, FMO activities and FMO1 protein was examined in the first experiment, and the expression of FMO1 mRNA was measured in the second experiment from kidneys after treatment with NaCl. A positive significant correlation was found between FMO1 protein expression and plasma osmolarity (p < 0.05, r = 0.6193). Methyl-p-tolyl sulfide oxidase showed a statistically significant increase in FMO activity, and a positive correlation was observed between plasma osmolarity and production of FMO1-derived (R)-methyl-p-tolyl sulfoxide (p < 0.05, r = 0.6736). Expression of FMO1 mRNA was also positively correlated with plasma osmolality (p < 0.05, r = 0.8428). Similar to studies in fish, these results suggest that expression and activities of FMOs may be influenced by hyperosmotic conditions in the kidney of rats.
Keywords: FMO, Osmoregulation, Rat Kidney
1. Introduction
Flavin-containing monooxigenases (FMOs) are a polymorphic family of enzymes and are found in the smooth endoplasmatic reticulum which catalyze the oxidation of soft nucleophilic heteroatom substances to their respective oxides (Ziegler, 1988, 1990; Cashman, 2004). Some known FMO substrates include alkaloids, pesticides and pharmaceutical compounds (Ziegler, 1990; Cashman, 1995). Five families of catalytically active isoforms of FMO have been identified and classified based on amino acid sequence (Cashman, 2004; Lawton et al., 1994). These isoforms differ in tissue distribution, regulation and substrate specificity (Ziegler, 1990; Krueger and Williams, 2005).
Previous studies have demonstrated that FMOs are regulated in response to changes in diet (Katchamart et al., 2000), sex hormones (Lee et al., 1993; Ripp et al., 1999; Lattard et al., 2002a; El-Alfy and Schlenk, 2002), pregnancy (Osimitz and Kulkarni, 1982; Williams et al., 1985), cortisol (El-Alfy et al., 2002), and in disease conditions, such as diabetes mellitus (Rouer et al., 1988; Borbás et al., 2006). However, the mechanisms that regulate FMOs during these events remain unclear. Since previous studies have demonstrated changes in FMO expression during physiological events that influence hormonal and osmotic status, expression of FMO isoforms in the kidney may be significantly altered (Lee et al., 1993).
Since the kidney can significantly contribute to extrahepatic biotransformation and bioactivation of nephrotoxic xenobiotics such as haloalkane thioethers (Barshteyn and Elfarra, 2007; Elfarra, 1995), it is critical to understand the impact of physiological alterations which influence expression of FMO within the kidney. The current study evaluated the effect of hyperosmotic conditions on FMO activity as well as gene and protein expression in rat kidney.
2. Materials and methods
2.1. Animals and systemic osmotic challenge
A total of 25 adult male Sprague–Dawley rats (350–450 g) were used for this study. The experiment was run in two separate trials. Rats were individually housed in a vivarium with a 12:12 h photoperiod and maintained with ad libitum access to standard rat chow pellets and water until the day of sacrifice. To alter osmolality, 11 rats were injected interperitoneally (i.p.: 0.6 cm3/100 g body weight) with 3.5 M NaCl (to produce acute dehydration). Nine control rats received 0.15 M NaCl (physiological saline control) and water was withheld until the animals were sacrificed 3.0–3.5 h later during which time plasma osmolarity has been shown to increase significantly reflecting the dehydrated state (Ludwig, 1988; Coburn et al., 2005). After injection, a blood sample from the tail was taken and plasma osmolarity was measured using a vapor pressure osmometer. Rats were subsequently killed by decapitation and kidney samples were taken immediately and frozen at −80 °C until enzymatic and immunoblot analysis. For qPCR analyses of FMO1 mRNA, a separate experiment was conducted where two animals were treated with saline control solution and three animals were treated with 0.3 cm3/100 g of 3.5 M NaCl for the same time period as above. A lower injection volume was used to try to provide a better distribution of salinities for regression analyses. Following blood sampling and decapitation as described above, kidneys were placed in RNALater solution before freezing at −80 °C until analysis. Due to placement in RNALater, neither protein measurements nor catalytic activities were evaluated. All animals manipulations were carried out under an approved protocol by the Institutional Animal Use and Care Committee for the University of California, Riverside.
2.2. FMO activities
Rat kidney microsomes were prepared as described previously (El-Alfy and Schlenk, 2002). FMO activities were measured using methyl-p-tolyl sulfide (MTS) as described in Schlenk et al. (2004) and Furnes and Schlenk (2004) which was a modification of Rettie et al. (1994). A 0.25 ml reaction volume containing 400 μg of microsomal protein, 1 mM NADPH 3.3 mM MgCl2, 1.0 mM MTS in a 50 mM glycine buffer pH 8.8 were incubated at 37 °C for 10 min. Previous studies had indicated that this was in the linear range for catalytic activity (Furnes and Schlenk, 2004). The reaction was stopped by the addition of 75 μl acetonitrile and centrifuged 5 min 10,000 × g. Supernatant was filtered with Millipore durapore (Bedford, MA) membrane and analyzed on a Regis Technologies (R,R) Whelk-01 10/100 chromasil chiral column. Samples were eluted with methanol 46% (v/v) (0–7 min) that was slowly increased to 100% (7–20 min). Purified (R)- and (S)-methyl-p-tolyl sulfoxides ((R)-and (S)-MTSO: Sigma–Aldrich, St. Louis, MO) were used to establish a standard curve. (R)- and (S)-enantiomers were eluted with retention times of 13.5 min and 14.5 min, respectively. Blanks omitted the addition of NADPH. Protein content of the microsomes was determined using the Bradford (1976) method. Bovine serum albumin was used as a standard.
2.3. Western blot
Microsomal proteins were separated by SDS-PAGE using a 10% polyacrylamide separating gel. Proteins were transferred to a nitrocellulose membrane using a semi-dry electrophoretic transfer cell (Biorad, Hercules, CA). Since enzyme activities indicated stereoselective formation of (R)-MTSO during hyperosmotic treatments, anti-guinea pig FMO1 (Yeung and Rettie, 2006) was used to measure protein expression. Although FMO2 also stereoselectively converts MTS to (R)-MTSO, an inactive truncated protein is expressed in rat kidney (Lattard et al., 2002b). Following incubation with the primary antibody and appropriate washing, an alkaline phosphatase-linked secondary antibody was used for detection. Bands were quantified using Gel Doc Software (Biorad, Hercules, CA).
2.4. Quantitative-PCR
Total RNA was extracted from kidney using QIAShredder (Qiagen, Valencia, CA) and RNEasy Mini RNA extraction Kit (Qiagen, Valencia, CA) following the manufacturer’s instructions. One microliter of isolated total RNA was reverse transcribed with 1 U of Super Spript™ Reverse Transcriptase (Invitrogen Life Technologies, Carlsbad, CA) in the presence of random hexamers according to the manufacturer’s instructions. One microliter of the reverse transcriptase reaction mixture was used for RCR amplications using primers for FMO1 (Lattard et al., 2002a). FMO1 was quantified with the SyBr-Green based qPCR method using an icycler iQ apparatus (Biorad, Hercules, CA). The standard mixture consisted of a 1:10,000 dilution of SyBr Green I (Molecular Probe), 10 mM Tris–HCl (pH 8.5), 40 mM KCl, 2 mM MgCl2, 0.1 mM dNTP, 10 pmol of each primer and 2.5 U of Taq polymerase in a 30 μl reaction volume. The optimal PCR conditions for quantification were determined using melting curve analysis by heating from 55 °C to 95 °C (0.5 C for 10 s per cycle for 80 cycles) with simultaneous detection of the SyBr Green I fluorescence signal. Twenty-eight cycles with a 56 °C alignment temperature were utilized for optimal quantification as this was in the linear range for amplification of the FMO1 signal. Forward Primers were 5′-TGT CAA GGG AAG CAA AGC-3′ and reverse primers were 5′-CCT GAA TCA AAG ACT CGG C-3′. A 447 bp fragment was resolved with electrophoresis on an agarose gel (1%) stained with ethidium bromide. β-Actin was used as a housekeeping gene using primers reported elsewhere (Nishimura et al., 2005). All PCR products were sequenced at the UCR Genomic Center to verify that PCR products corresponded to amplicons of the targeted genes.
2.5. Statistical analysis
Differences between treatments were calculated using Student’s t-test for parametric data and Mann–Whitney U-test for non-parametric data. Correlation between variables was calculated using the Spearman rank order method. Criterion for significance was set at p ≤ 0.05.
3. Results
As a result of intra-peritoneal injection with 3.5 M NaCl plasma osmolarity increased from a mean of 298.77 ± 4.86 in control rats (n = 9) to 347.82 ± 15.06 mOsm in osmotically stimulated animals (n = 11). Mann–Whitney U-test indicated that the increase in plasma osmolarity was statistically significant with respect to control animals (p = 0.0002).
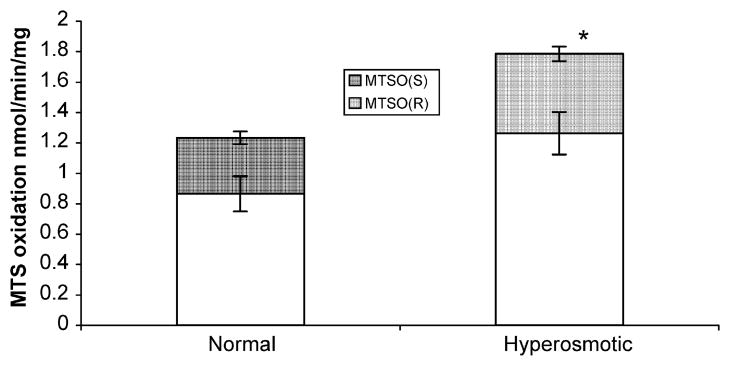
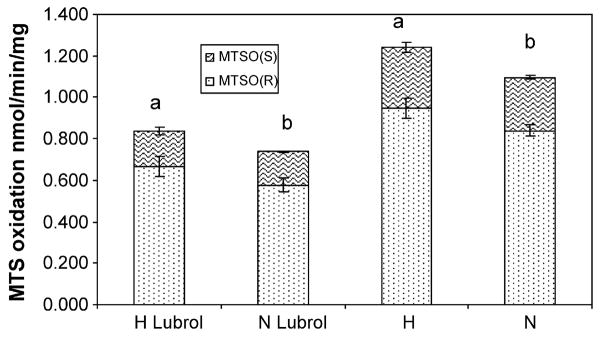
MTS oxidase showed a significant increase with hypersaline treatment (p = 0.002, Fig. 1). Kidney microsomes produced MTSO at a 70:30 ratio for (R) or (S) enantiomers, and there was no significant difference in this ratio between normal or hyperosmotic rats (p = 0.8). Pretreatment with lubrol reduced the formation of MTSO-(R) and MTSO-(S) 30% and 40%, respectively in hyperosmotic and normal rats (Fig. 2). There were no differences in the R/S ratio between normal or hyperosmotic animals when both were pretreated with lubrol (p = 0.06); but there was a statistically significant increase in the production of MTSO-(R) between hyperosmotic (p = 0.01, Fig. 2) or normal (p = 0.01, Fig. 2) rats with respect to lubrol pre-treatment.
Fig. 1.
Methyl-p-tolyl sulfide oxidation by rat kidney microsomes. Comparison of activities in normal or hyperosmotic rats. Bars represent mean activities of (R) or (S) metabolites ± standard deviation. *Significant differences at p ≤ 0.05.
Fig. 2.
Effect of lubrol in methyl-p-tolyl sulfide oxidation by rat kidney microsomes. Comparison of activities between normal (N) or hyperosmotic (H) rats. Bars represent mean activities of (R) or (S) metabolites ± standard deviation. Equal letters represent significant differences between treatments at p ≤ 0.05.
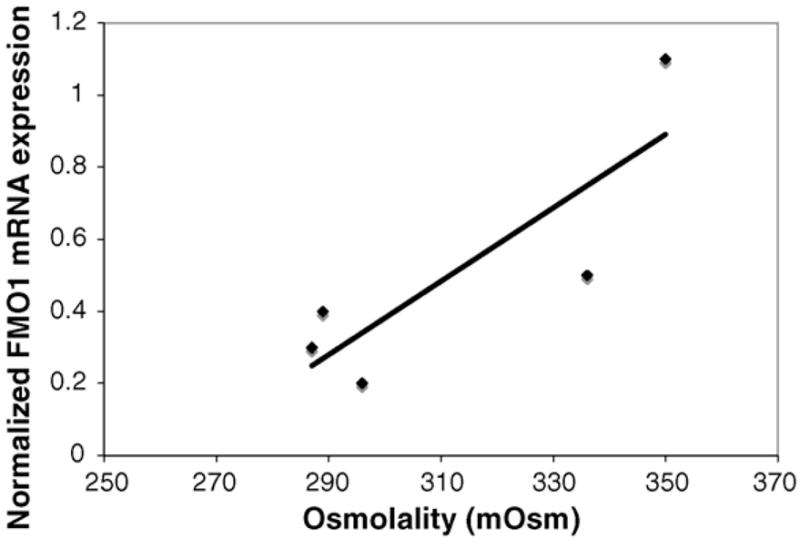
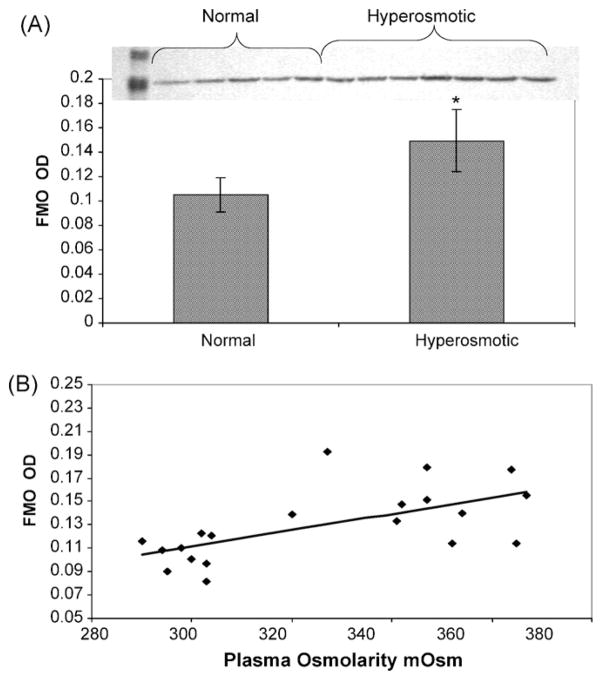
Densitometric analysis of western blots showed a significant increase in FMO1 protein expression in hyperosmotic rats (Fig. 3A, p = 0.0002). Plasma osmolarity presented a significant positive correlation with FMO1 protein expression (p < 0.05, r = 0.6193, Fig. 3B) and with the production of (R)-MTSO (p < 0.05, r = 0.6735, data not shown). qPCR evaluation for FMO1 mRNA indicated a direct positive correlation with plasma osmolality (p < 0.05, r = 0.8428, Fig. 4).
Fig. 3.
Effect of hyperosmotic conditions in rat kidney. (A) FMO1 protein expression in rat kidney microsomes in normal or hyperosmotic rats. Bars represent mean ± standard deviation. *Significant differences at p = 0.05. (B) FMO1 correlation between protein expression in rat kidney microsomes and plasma osmolarity.
Fig. 4.

Relationships between hyperosmotic conditions and FMO1 mRNA expression in rat kidneys from animals treated with NaCl.
4. Discussion
Given the critical physiological role of the kidney in osmoregulation of mammals and its role in extrahepatic biotransformation, FMO regulation under hyperosmotic conditions was evaluated in rat kidney. Previous studies of FMOs in rat kidney have demonstrated expression of FMO1, FMO3 and FMO5 (Lattard et al., 2002a; Krause et al., 1996; Cherrington et al., 1998). Thus, catalytic activities, mRNA and protein expression in the kidney were compared after hyperosmotic treatments in the rat. Formation of (R)-MTSO stereoisomer was enhanced by hyperosmotic treatments. Production of (R)-MTSO enantiomers is stereoselective in FMOs; for example (R)-MTSO formation is preferentially catalyzed by FMO1 and FMO2 (human [Sadeque et al., 1992; Furnes and Schlenk, 2004], rabbit [Rettie et al., 1994]), (S)-MTSO is preferentially formed by FMO5 (rabbit [Fisher et al., 1995]) and FMO3 lacks stereoselectivity for formation of MTSO (rabbit [Rettie et al., 1995]). Lubrol has been shown to be an effective inhibitor of CYP, but not FMO in microsomal incubations (Rettie et al., 1994). When MTS was used as a substrate in kidney microsomes, activities after treatment with lubrol indicated that FMOs were participating in about 60–70% of the MTS oxidation.
MTSO formation was well correlated with FMO1 protein expression in hyperosmotic rats, which also correlated with plasma osmolarity. Expression of FMO1 mRNA also correlated with hyperosmotic conditions. Up-regulation of FMO mRNA, protein and catalytic activity by hyperosmotic conditions in euryhaline fish has been previously described (El-Alfy et al., 2002; Schlenk et al., 1996; Larsen and Schlenk, 2001) and studies in rainbow trout have demonstrated an increase in FMO activity when plasma osmolarity is augmented (Larsen and Schlenk, 2001). Treatment of isolated primary hepatocytes with NaCl and cortisol enhanced the expression of a novel FMO mRNA (Rodríguez-Fuentes et al., 2008). The similarity between piscine and mammalian FMO up-regulation in the presence of osmotic stress may indicate that FMOs play an osmoregulatory role in both systems, perhaps by promoting the formation of “compatible” organic osmolytes (such as trimethylamine N-oxide) or maintaining the redox potential through sulfhydryl metabolism. Studies are underway to identify potential mechanisms regulating FMO by hyperosmotic conditions.
In summary, hyperosmotic conditions increased FMO1 protein expression and FMO1-specific catalytic activity in rat kidneys. There was also a correlation between FMO1 mRNA, and plasma osmolarity. These results suggest that substrates activated by FMO in the kidney such as certain pesticides and thioether metabolites of halogenated hydrocarbons may be more toxic in osmotically stressed animals.
Acknowledgments
The authors would like to thank UC Mexus-CONACYT Postdoctoral Fellowship for its financial support for this project and to Dr. Ramón Lavado for his technical assistance.
Footnotes
Conflict of interest
No conflict of interest.
References
- Barshteyn N, Elfarra AA. Formation of three N-acetyl-L-cysteine monoadducts and one diadduct by the reaction of S-(1,2-dichlorovinyl)-L-cysteine sulfoxide with N-acetyl-L-cysteine at physiological, conditions: chemical mechanisms and toxicological implications. Chem Res Toxicol. 2007;20:1563–1569. doi: 10.1021/tx700263w. [DOI] [PubMed] [Google Scholar]
- Bradford M. A rapid and sensitive method for the quantification of microgram protein utilizing the principle of protein–dye binding. Anal Biochem. 1976;72:248–254. doi: 10.1006/abio.1976.9999. [DOI] [PubMed] [Google Scholar]
- Borbás T, Benko B, Dalmadi B, Szabó I, Tihanyi K. Insulin in flavin-containing monooxygenase regulation: flavin-containing monooxygenase and cytochrome P450 activities in experimental diabetes. Eur J Pharm Sci. 2006;28:51–58. doi: 10.1016/j.ejps.2005.12.011. [DOI] [PubMed] [Google Scholar]
- Cashman JR. Structural and catalytic properties of the mammalian flavin-containing monooxigenase. Chem Res Toxicol. 1995;8:165–181. doi: 10.1021/tx00044a001. [DOI] [PubMed] [Google Scholar]
- Cashman JR. The implication of polymorphisms in mammalian flavin-containing monooxigenases in drug discovery and development. Drug Discov Today. 2004;9:574–581. doi: 10.1016/S1359-6446(04)03136-8. [DOI] [PubMed] [Google Scholar]
- Cherrington NJ, Cao Y, Cherrington JW, Rose RL, Hodgson E. Physiological factors affecting protein expression of flavin-containing monooxygenase 1, 3 and 5. Xenobiotica. 1998;28:673–682. doi: 10.1080/004982598239254. [DOI] [PubMed] [Google Scholar]
- Coburn CG, Gillard ER, Currás-Collazo MC. Dietary exposure to Aroclor 1254 alters central and peripheral vasopressin release in response to dehydration in the rat. Toxicol Sci. 2005;84:149–156. doi: 10.1093/toxsci/kfi046. [DOI] [PubMed] [Google Scholar]
- El-Alfy A, Schlenk D. Effect of 17β-estradiol and testosterone on the expression of flavin containing monooxygenase and the toxycity of aldicarb to Japanese Medaka, Oryzias latipes. Toxicol Sci. 2002;68:381–388. doi: 10.1093/toxsci/68.2.381. [DOI] [PubMed] [Google Scholar]
- El-Alfy A, Larsen B, Schlenk D. Effect of cortisol and urea on flavin monooxygenase activity and expression in rainbow trout, Oncorhynchus mykiss. Mar Environ Res. 2002;54:275–278. doi: 10.1016/s0141-1136(02)00183-6. [DOI] [PubMed] [Google Scholar]
- Elfarra AA. Potential role of the flavin-containing monooxygenases in the metabolism of endogenous compounds. Chem Biol Interact. 1995;96:47–55. doi: 10.1016/0009-2797(94)03582-s. [DOI] [PubMed] [Google Scholar]
- Fisher MB, Lawton MP, Atta-Asafo-Adjei E, Philpot RM, Rettie AE. Selectivity of flavin-containing monooxygenase 5 for the (S) sulfoxidation of short-chain aralkyl sulfides. Drug Metab Dispos. 1995;23:1431–1433. [PubMed] [Google Scholar]
- Furnes B, Schlenk D. Evaluation of xenobiotic N- and S-oxidation by variant flavin-containing monooxygenase 1 (FM01) enzymes. Toxicol Sci. 2004;78:196–203. doi: 10.1093/toxsci/kfh079. [DOI] [PubMed] [Google Scholar]
- Katchamart S, Stresser DM, Dehal SS, Kupfer D, Williams E. Concurrent flavin-containing monooxygenase down-regulation and cytochrome P-450 induction by dietary indoles in rat: implications for drug–drug interaction. Drug Metab Dispos. 2000;28:931–936. [PubMed] [Google Scholar]
- Krause R, Ripp SL, Sausen PJ, Overby LH, Philpot R, Elfarra A. Characterization of the methionine S-oxidase activity of rat liver and kidney microsomes: immunochemical and kinetic evidence for FMO3 being the major catalyst. Arch Biochem Biophys. 1996;333:109–116. doi: 10.1006/abbi.1996.0370. [DOI] [PubMed] [Google Scholar]
- Krueger SK, Williams DE. Mammalian flavin-containing monooxygenases: structure/function, genetic polymorphisms and role in drug metabolism. Pharmacol Therap. 2005;106:287–357. doi: 10.1016/j.pharmthera.2005.01.001. [DOI] [PMC free article] [PubMed] [Google Scholar]
- Larsen BK, Schlenk D. Effect of salinity on flavin-containing monooxygenase expression and activity in rainbow trout (Onchorhynchus mykiss) J Comp Physiol B. 2001;171:421–429. doi: 10.1007/s003600100192. [DOI] [PubMed] [Google Scholar]
- Lattard V, Lachuer J, Buronfosse T, Garnier F, Benoit E. Physiological factors affecting the expression of FMO1 and FMO3 in the rat liver and kidney. Biochem Pharmacol. 2002a;63:1453–1464. doi: 10.1016/s0006-2952(02)00886-9. [DOI] [PubMed] [Google Scholar]
- Lattard V, Longin-Sauvageon C, Krueger SK, Williams DE, Benoit E. The FMO2 gene of laboratory rates, as in most humans encodes a truncated protein. Biochem Biophys Res Commun. 2002b;292:558–563. doi: 10.1006/bbrc.2002.6656. [DOI] [PubMed] [Google Scholar]
- Lawton MP, Cashman JR, Cresteil T, Dolphin CT, Elfarra AA, Hines RN, Hogson E, Kimura T, Ozols J, Phillips IR, et al. A nomenclature for the mammalian flavin-containing monoxygenases gene family based on amino acid sequence identities. Arch Biochem Biophys. 1994;308:254–257. doi: 10.1006/abbi.1994.1035. [DOI] [PubMed] [Google Scholar]
- Lee MY, Clark JE, Williams DE. Induction of flavin-containing monooxygenase (FMO B) in rabbit lung and kidney by sex steroids and glucocorticords. Arch Biochem Biophys. 1993;302:332–336. doi: 10.1006/abbi.1993.1219. [DOI] [PubMed] [Google Scholar]
- Ludwig M. Dendritic release of vasopresion and oxytocin. J Neuroendocrinol. 1988;10:881–895. doi: 10.1046/j.1365-2826.1998.00279.x. [DOI] [PubMed] [Google Scholar]
- Nishimura N, Yonemoto J, Nishimura H, Ikushiro S, Tohyama C. Disruption of thyroid hormone homeostasis at weaning of holtzman rats by lactational but not in utero exposure to 2,3,7,8-tetrachlorodibenzo-p-dioxin. Toxicol Sci. 2005;85:607–614. doi: 10.1093/toxsci/kfi122. [DOI] [PubMed] [Google Scholar]
- Osimitz TG, Kulkarni AP. Oxidative metabolism of xenobiotics during pregnancy. Significance of microsomal flavin-containing monooxygenase. Biochem Biophys Res Commun. 1982;109:1164–1171. doi: 10.1016/0006-291x(82)91899-x. [DOI] [PubMed] [Google Scholar]
- Rettie AE, Lawton MP, Sadeque AJM, Meier GP, Philpot RM. Prochiral sulfoxidation as a probe for multiple forms of the microsomal flavin-containing monooxygenase: studies with rabbit FMO1, FMO2, FMO3, and FMO5 expressed in Escherichia coli. Arch Biochem Biophys. 1994;311 (2):369–377. doi: 10.1006/abbi.1994.1250. [DOI] [PubMed] [Google Scholar]
- Rettie AE, Meier GP, Sadeque AJ. Prochiral sulfides as in vitro probes for multiple forms of the flavin-containing monooxigenase. Chem Biol Interact. 1995;28:3–15. doi: 10.1016/0009-2797(94)03579-w. [DOI] [PubMed] [Google Scholar]
- Ripp S, Itagaki K, Philpot R, Elfarra A. Species and sex differences in expression of flavin-containing monooxygenase form 3 in liver and kidney microsomes. Drug Metab Dispos. 1999;27:46–52. [PubMed] [Google Scholar]
- Rodríguez-Fuentes G, Aparicio-Fabré R, Li Q, Schlenk D. Osmotic regulation of a novel flavin-containing monooxygenase in primary cultured cells from rainbow trout (Oncorhynchus mykiss) Drug Metab Dispos. 2008;36:1212–1217. doi: 10.1124/dmd.107.019968. [DOI] [PMC free article] [PubMed] [Google Scholar]
- Rouer E, Rouet P, Delpech M, Leroux JP. Purification and comparison of liver microsomal flavin-containing monooxygenase from normal and streptozotocin-diabetic rats. Biochem Pharmacol. 1988;37:3455–3459. doi: 10.1016/0006-2952(88)90696-x. [DOI] [PubMed] [Google Scholar]
- Sadeque AJ, Eddy AC, Meier GP, Rettie AE. Stereoselective sulfoxidation by human flavin-containing monooxygenase. Evidence for catalytic diversity between hepatic, renal, and fetal forms. Drug Metab Dispos. 1992;20:832–839. [PubMed] [Google Scholar]
- Schlenk D, Peters LD, Livingstone DR. Correlation of salinity with flavin-containing monooxygenase activity but not cytochrome P450 activity in the euryhaline fish (Platichthys flesus) Biochem Pharmacol. 1996;52:815–818. doi: 10.1016/0006-2952(96)00358-9. [DOI] [PubMed] [Google Scholar]
- Schlenk D, Yeung C, Rettie A. Unique stereoselective sulfoxidation of thioethers indicates novel flavin-containing monooxygenase in liver of rainbow trout. Mar Environ Res. 2004;58:499–503. doi: 10.1016/j.marenvres.2004.03.036. [DOI] [PubMed] [Google Scholar]
- Williams DE, Hale SE, Muerhoff AS, Masters BSS. Rabbit lung flavin-containing monooxygenase—purification, characterization, and induction during pregnancy. Mol Pharmacol. 1985;28:381–390. [PubMed] [Google Scholar]
- Yeung CK, Rettie AE. Prochiral sulfoxidation as a probe for flavin-containing monooxigenases. Methods Mol Biol. 2006;320:163–172. doi: 10.1385/1-59259-998-2:163. [DOI] [PubMed] [Google Scholar]
- Ziegler DM. Flavin-containing monooxygenase: catalytic mechanisms and substrate specificities. Drug Metab Rev. 1988;19:1–32. doi: 10.3109/03602538809049617. [DOI] [PubMed] [Google Scholar]
- Ziegler DM. Flavin-containing monooxygenase: enzymes adapted for multi-substrate specificity. Trends Pharmacol Sci. 1990;11:321–324. doi: 10.1016/0165-6147(90)90235-z. [DOI] [PubMed] [Google Scholar]


