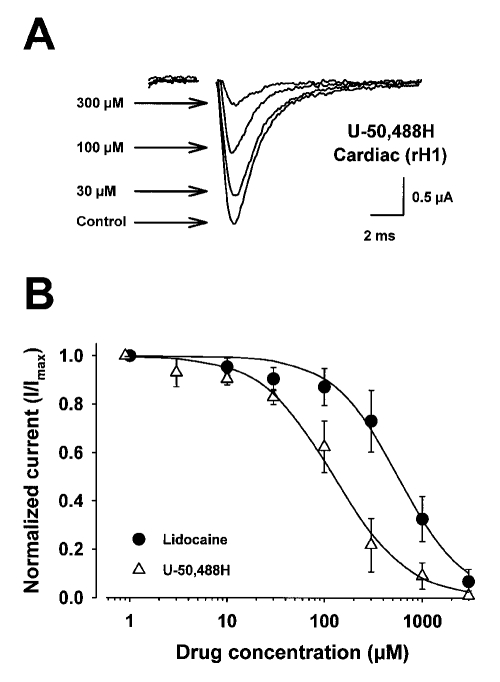
Figure 2.
Concentration-response curves for the effect of lidocaine and U-50,488H on rat heart (rH1) sodium currents expressed in Xenopus laevis oocytes. Currents were recorded by two-electrode whole-cell voltage clamp. Oocytes were injected with 50 ng of in vitro transcribed RNA encoding the rH1 sodium channel alpha-subunit. After two days of incubation at 20°C in ND-96 plus supplements, current-voltage curves were evoked by depolarizing the cell to various potentials from a fixed prepulse potential of −90 mV. The data were filtered at 3 kHz. Peak sodium currents, evoked every 6 s, were measured at test potentials that elicited maximum inward current (−10 mV). Peak sodium currents were measured again after 5 min perfusion of the cell at a flow rate of 1 to 2 mL/min of ND96 containing increasing concentrations of either U-50,488H or lido-caine. The data are shown as peak current normalized to the maximum current in the absence of drug (I/Imax). The curves described by the solid lines were fitted by the Hill equation where INa = [1 + ([A]/EC50)n]−1. INa describes the fraction of maximal current remaining after block by either drug, [A] is the concentration of drug, EC50 is the concentration of drug at half-maximal block, and n is the Hill coefficient describing the stoichiometry of the drug-channel interaction. Concentration-response curves are mean ± SD for five oocytes. The parameters of the fits are shown in Table 2

