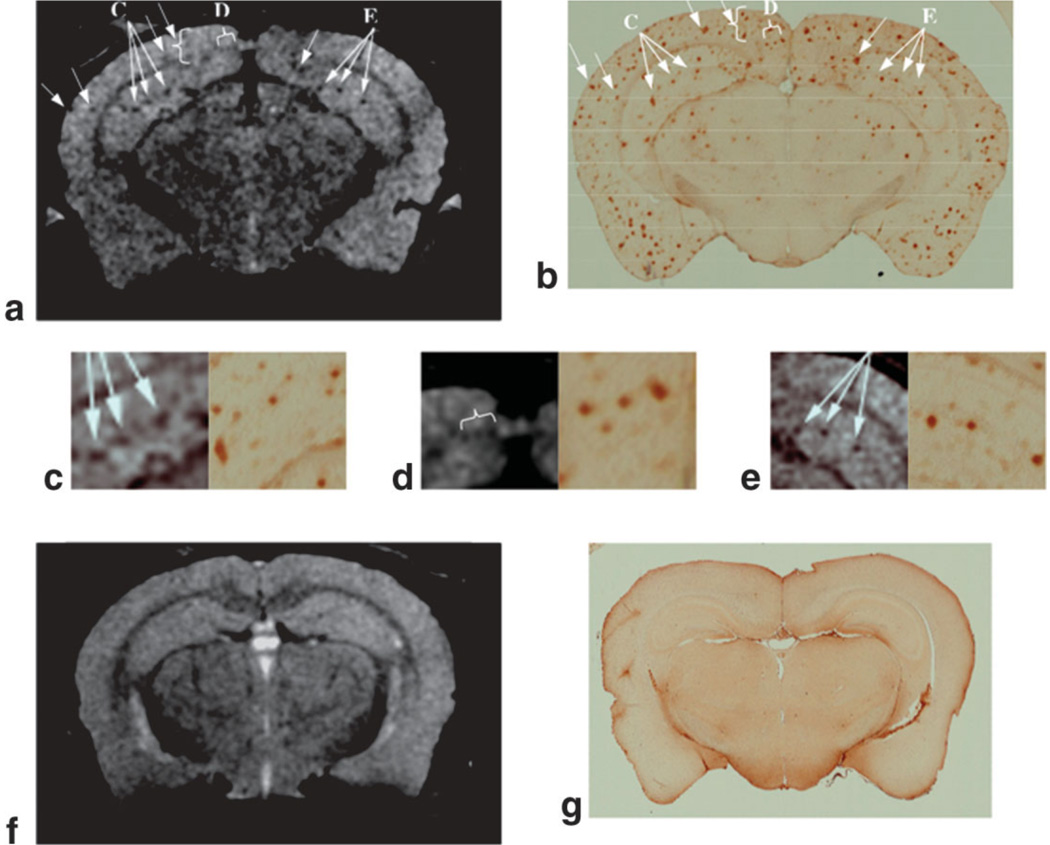
Figure 2.
a: A T1ρ-weighted MR image of the APP/PS1 mouse brain shows hypointense regions, some of which are indicated by arrows. b: The corresponding histologic image created by combining five 10-µm-thick immunostained sections shows abundant Aβ deposits. c–e: The higher magnification views correspond to regions indicated by the arrows in part a to show identical clusters of Aβ deposits in the hippocampus and cortex in both MR images and histological sections. The T1ρ-weighted MR image of an age-matched control (f) and corresponding histology (g) failed to show SPs.

