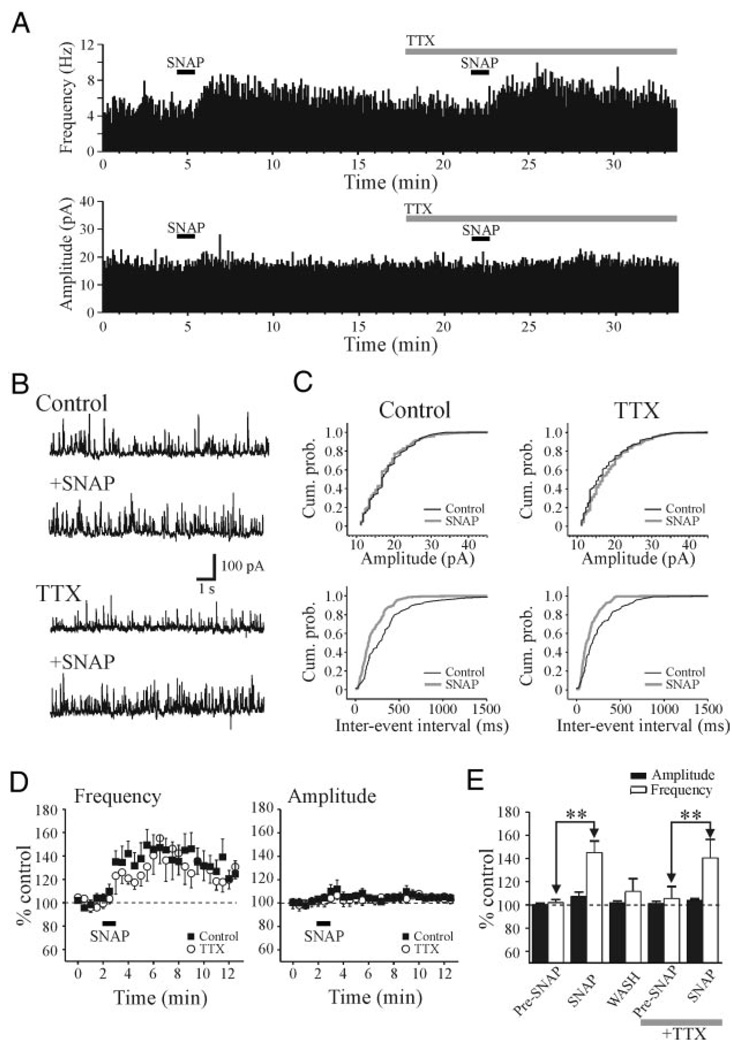
FIG. 3.
SNAP-mediated increase in IPSCs persists in tetrodotoxin (TTX). A: histograms illustrating the frequency and amplitude of sIPSCs from a dLGN relay neuron. Histograms were constructed using 5-s bins. In control conditions, SNAP (500 µM) produced a robust increase in sIPSC frequency. In TTX (0.5 µM), the SNAP-mediated increase in sIPSC activity persists. B: representative traces from neuron in A that illustrate sIPSC activity in different experimental conditions. C: cumulative probability plots of amplitude and interevent intervals from neuron in A. Note that the clear increase in the interevent intervals even in both control and TTX conditions. D: summary plots of the population data (n = 10 cells) illustrating the action of SNAP on sIPSC amplitude and frequency. Data are presented as percentage of control levels in normal ACSF (filled squares) and after TTX (open circles). E: histogram plot illustrates the peak SNAP-mediated actions on sIPSC amplitude (filled bars) and frequency (open bars). **P < 0.01.

