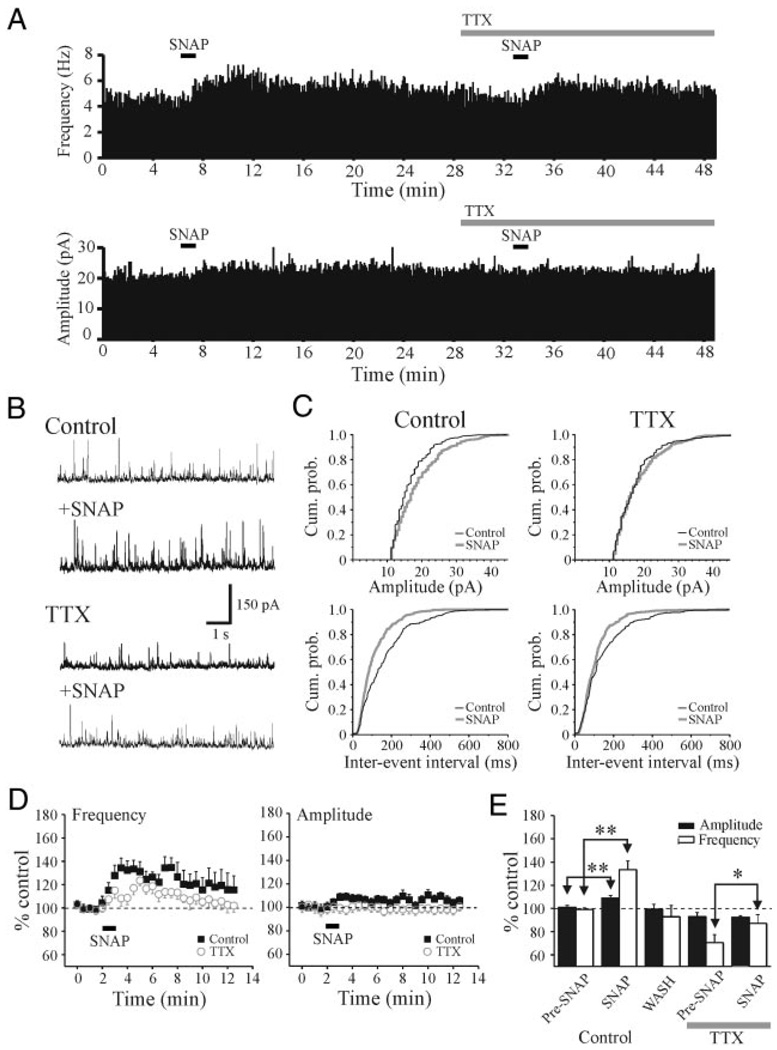
FIG. 7.
SNAP-mediated potentiation of sIPSCs in ventrobasal thalamic (VB) nucleus. A: histograms illustrate sIPSC frequency and amplitude from a representative VB relay neuron. In control conditions, SNAP (500 µM) produces an increase in sIPSC activity similar to that observed in dLGN relay neurons. In TTX (0.5 µM), the SNAP-mediated facilitation of sIPSC persists. B: representative traces illustrating sIPSC activity in the different experimental conditions. C: cumulative probability plots of sIPSC amplitudes and inter-event intervals from neuron in A. Note that clear increase in sIPSC amplitudes and interevent intervals produced by SNAP in control conditions. In TTX, SNAP produces an increase only in sIPSC interevent intervals. D: population data (n = 9 neurons) indicate an increase in sIPSC frequency by SNAP before (filled squares) and after TTX application (open circles). E: histogram plot illustrates the average peak change in sIPSC amplitude (filled bars) and frequency (open bars) produced by SNAP in different conditions. **P < 0.01, *P < 0.05.

