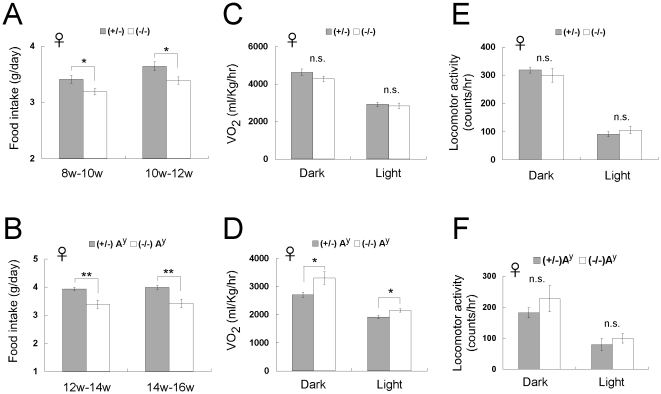
Figure 3. Comparison of food intake, energy expenditure, and locomotor activity between CXCL14 +/− and CXCL14 −/− female mice.
(A, B) Daily food intake of female CXCL14 +/− (n = 8) and CXCL14 −/− (n = 7) mice (A), and female CXCL14 +/−Ay (n = 8) and CXCL14 −/−Ay (n = 4) mice (B). (C–F) Oxygen consumption of female CXCL14 +/− (n = 6) and CXCL14 −/− (n = 6) mice (C), and female CXCL14 +/−Ay (n = 6) and CXCL14 −/−Ay (n = 3) mice (D), and locomotor activity of female CXCL14 +/− (n = 4) and CXCL14 −/− (n = 6) mice (E), and female CXCL14 +/−Ay (n = 8) and CXCL14 −/−Ay (n = 5) mice (F) during night- and daytime are shown. Sixteen to 20 week-old mice were used for these experiments. Each data point represents the mean ± SEM. *, P<0.05; **, P<0.01; n.s., not significant compared to the corresponding value for CXCL14 +/− control mice.

