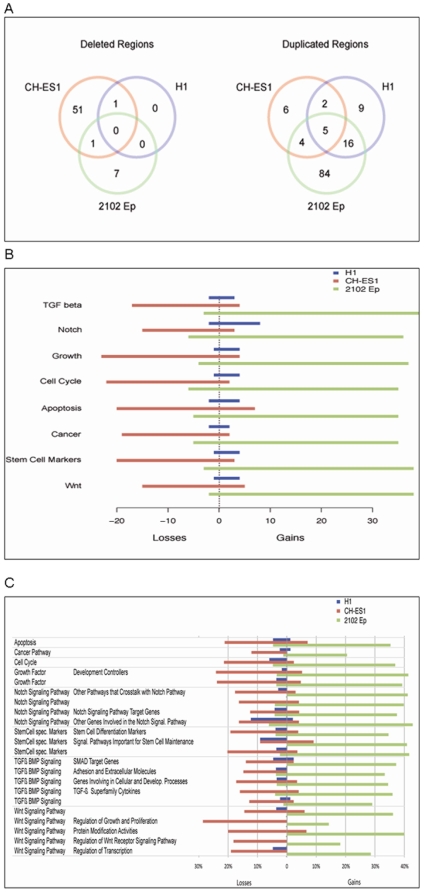
Figure 4. Pathway analyses of gained and lost genes in the analysed cell lines.
A) The number of pathways which were statistically significantly enriched per line involving deleted (left panel) and duplicated (right panel) genes. B) The number of lost and gained genes per cell line in summary pathways. C) The percentage of genes altered per pathway by deletion or duplication. Only pathways with copy number variations are shown.

