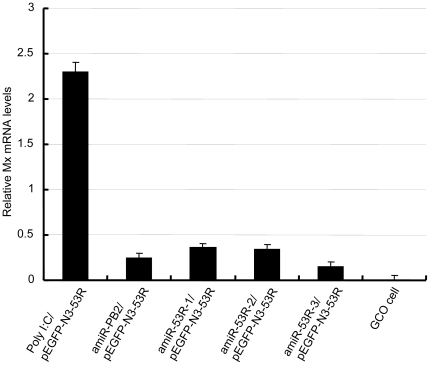
Figure 6. Expression of the Mx in different transfected cells.
Quantitative real time PCR was used to measure Mx mRNA. The value of the control (GCO cell) was designated as 0 (n = 3). Expression of Mx gene was not significantly changed when compared to the control except in cells treated with poly I:C. The values represent averages of three independent experiments, with the range indicated (±S.D).

