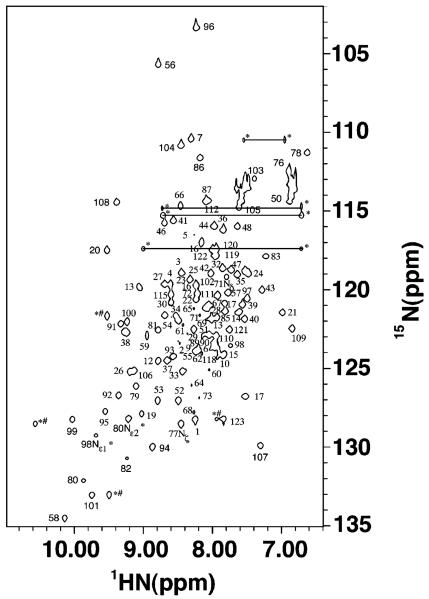
Figure 1.
1H–15N HSQC spectrum of 15N-labeled frataxin. The spectrum was collected at 30 °C on a Varian INOVA 600 MHz NMR spectrometer. Corresponding peak assignments are given adjacent to spectral features. Side chain amine signals are designated with asterisks and connected to partners by a line when applicable. Aliased peaks are designated with pound signs.

