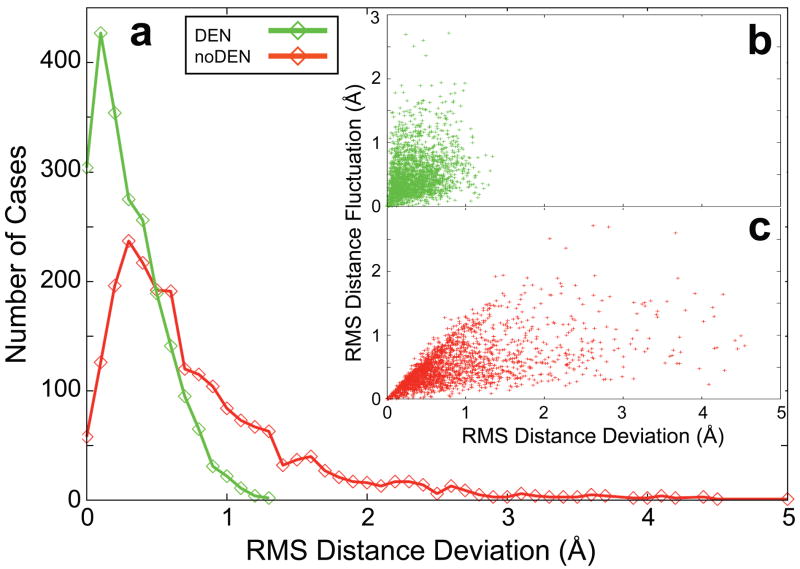
Figure 4. DEN provides information for degrees of freedom that are weakly defined by the experimental diffraction data.
(a) Showing DEN (green) and noDEN (red) histograms of, RMSDD, the root-mean-square deviation of DEN restraint distances in the target structure (3app) from those in the ten refinement repeats (starting from the 4ape initial model with dmin=4.5Å, the MLHL target function24, and DEN optimum parameters (γ,wDEN)=(0,10); see Fig. 1a). The largest RMSDD is much smaller for DEN compared to noDEN. Inset: the RMS Fluctuations of each distance over the ten repeats of noDEN refinement (RMSF) are plotted against RMSDD for DEN (b, green) and noDEN (c, red). Large RMSF values (>1.5 Å) represent the DEN distances that are not well defined by the diffraction data. For DEN, these distances have small RMSDD values (<1.0 Å) whereas for noDEN they have large RMSDD values. Restraint distances are much closer to the distances in the target structure for DEN, which effectively provides information missing from low-resolution experimental data.

