Figure 3.
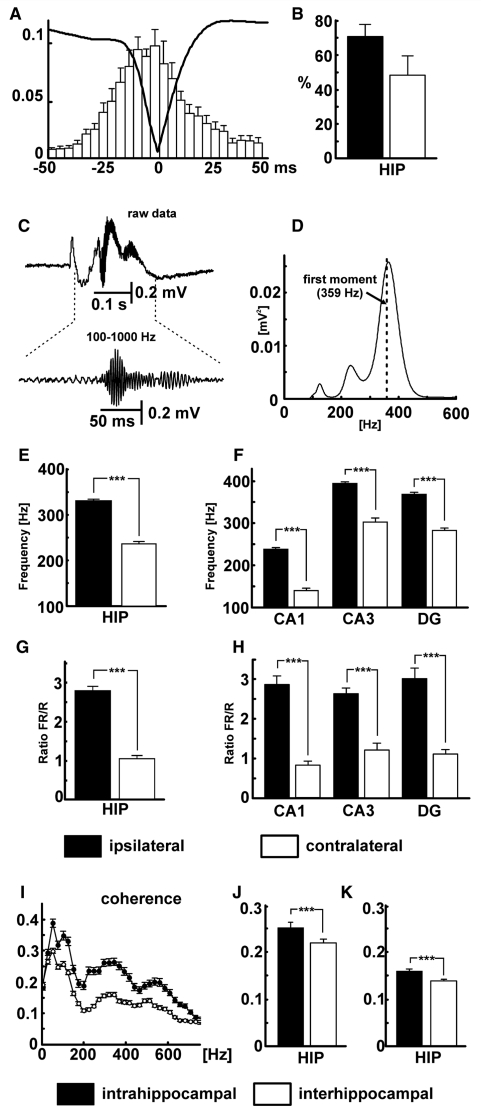
Properties of HFA. (A) Averaged interictal discharge waveform superimposed on cross-correlation between HFA and interictal discharge shows that HFA can be observed throughout the entire course of interictal discharge with maximal probability of occurrence during the peak of interictal discharge. (B) Proportion of interictal discharges with superimposed HFA in ipsilateral (filled bar) and contralateral (open bar) hippocampi. (C) Epoch lasting 0.5 s including an interictal discharge, with expansion of band-pass filtered HFA below, recorded from ipsilateral CA3. (D) Corresponding power spectrum for the band passed 0.5 s interictal epoch shown in C (dashed line shows first moment at 359 Hz). (E) Comparison of first spectral moment in ipsilateral and contralateral hippocampi. (F) First spectral moments in subregions of ipsilateral and contralateral hippocampi. (G) Comparison of ratio of fast ripple (FR) to ripple (R) power in ipsi- and contralateral hippocampi (i.e. the summated HFA powers below and above 250 Hz for all interictal events in all epileptic rats). (H) Ratios of fast ripple to ripple power in subregions of ispilateral and contralateral hippocampi. (I) Intrahippocampal (filled symbols) and interhippocampal (open symbols) coherence. (J) Mean values of intra- and interhippocampal coherence for ripple band (filled and open bars, respectively). (K) Mean values of coherence for fast ripple band. (Error bars represent SEM, significance values are ***P < 0.001). DG = dentate gyrus; HIP = hippocampi.

