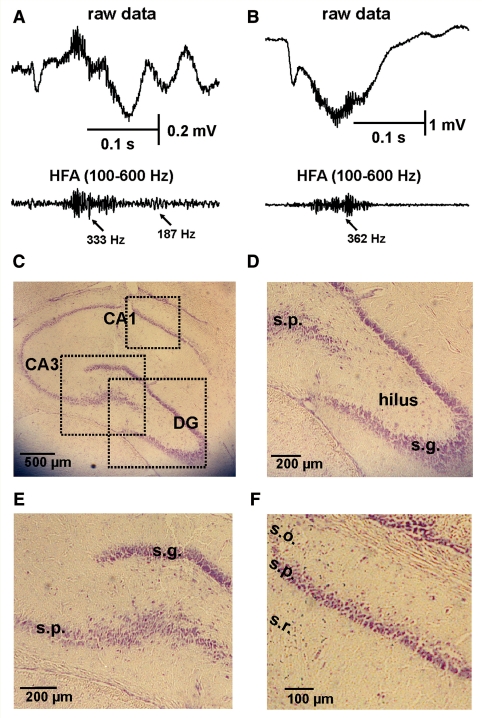
Figure 7.
Histology from hippocampus exhibiting interictal discharges with HFA. (A) Interictal discharge recorded in the ipsilateral CA3 with superimposed HFA progressing from 333 to 187 Hz. (B) Interictal discharge from the ipsilateral dentate gyrus (DG) with superimposed HFA at 362 Hz. (C) Histology of ipsilateral hippocampus showing electrode track (Nissl stain). (D) Detail of dentate gyrus histology. (E) Detail of CA3 histology. (F) Detail of CA1 histology. In A and B, top trace is raw data and the bottom is band-pass filtered 100–600 Hz. Note absence of hippocampal sclerosis and substantial neuronal loss. s.g. = stratum granulosum; s.p. = stratum pyramidale; s.o. = stratum oriens; s.r. = stratum radiatum. See also Jefferys et al. (1992).

