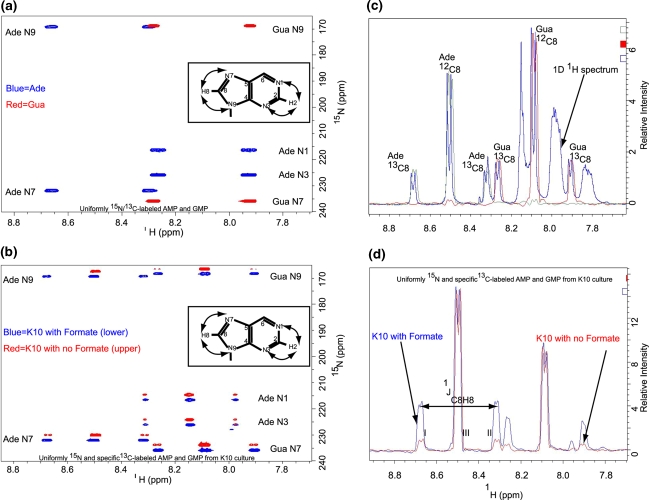
Fig. 3.
Estimation of C2 and C8-13C labeling efficiency using two- and three-bond 15N-HSQC experiment without carbon decoupling during acquisition. The 2D 1H-15N HSQC spectra depict H8-N7/N9 crosspeaks for Ade and Gua and H2-N1/N3 correlations for Ade. At each N1 and N3 nitrogen position a singlet is observed for the H2 proton at 8.14 ppm if the C2 carbon is unlabeled and a doublet if C2 carbon is 13C-labeled due to the large one bond 1H-13C coupling of ~202 Hz. Similarly at each N7 and N9 nitrogen position a singlet is observed for the H8 proton at 8.5 ppm (for Ade) and 8.08 ppm (for Gua) if C8 is unlabeled and a doublet if C8 is13C-labeled due to the large one bond 1H-13C coupling of ~215 Hz. Thus the ratio of each satellite peak to the central peak gives a good estimate of the degree of 13C- labeling. a The 2D 2JHN HSQC spectra for uniformly labeled NMPs (AMP, red; GMP, blue) are superimposed. The inset shows the observable long range 1H-15N correlations in the purine ring. b 2D 2JHN HSQC spectra for the mixture of four rNMPs obtained from the K10 bacterial culture are superimposed (the spectrum obtained without labeled formate, red contours and upper; formate labeled spectrum, blue contours and lower). The H2 protons and N1 and N3 nitrogen atoms and H8 protons and the N7 atoms in nucleotides labeled using K10 with formate in a 13C-2-glycerol background are depicted. The carbon decoupling field is turned off during acquisition. c The aromatic region of all 4 rNMPs extracted from K10 cultures. The 1H spectrum with no 13C-decoulpling during acquisition (blue) is superimposed on 1D slices of the rows corresponding to the nitrogen chemical shifts of Ade N7 (green) and Gua N7 (red; see Fig. 3b). The 1D slices from the 2D 2JHN HSQC spectra overlay completely with the proton spectrum, suggesting the percentage label can be estimated using either the 2D or 1D experiment, but the 2D is preferable in case of overlap. d 1D section of the Pur N7 position (see Fig. 3b) is depicted for labeled rNMPs without formate (red) and with formate (blue). The satellite peaks are labeled I and II, and the center peak is labeled III

