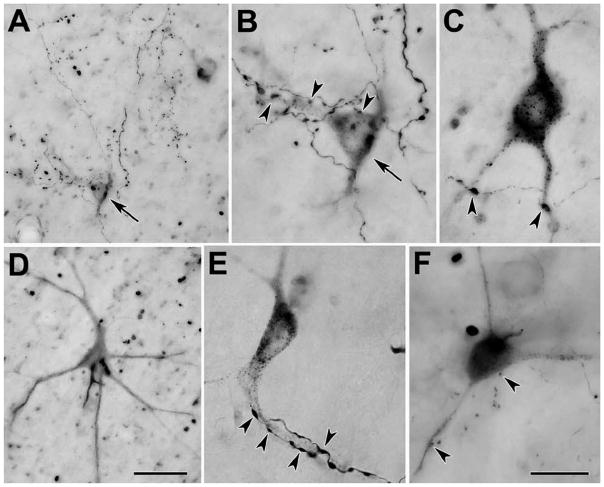
Figure 7.
Photomicrographs of BDA labeled reticulospinal neurons and spinoreticular axons in the cat. Close associations (arrowheads) between labeled axonal boutons and labeled cells were observed in many cases (A–C,E&F), although well labeled neurons sometimes showed no such contacts (D). Only rarely did the same axon provide numerous boutons to the same cell (E). Bouton size was variable (Compare E&F). As indicated by arrows, the cell in A is shown at higher magnification in B. Scale bar = 50 μm in D and 20 μm in F. Scale for A=D; B,C&E=F. The number of z-axis planes combined to make plate A=15, B=10, C=1, D=15, E=1, F=10.

