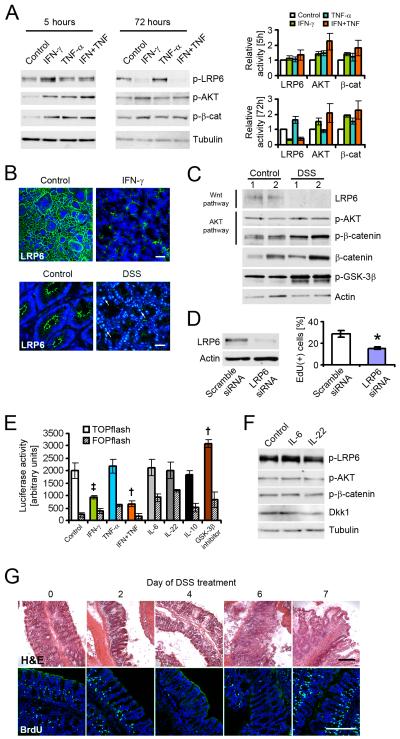
Figure 3.
Inflammatory cytokines differentially regulate AKT and Wnt signaling pathways. (A) Activity of LRP6 (phosphorylation of Ser1490), AKT (phosphorylation of Thr308), and β-catenin (phosphorylation of Ser552) in T84 cells was analyzed after 5 and 72 hours. IFN-γ activated AKT-β-catenin signaling, but inhibited Wnt activity. TNF-α partially amplified this effect. (B) Upper panels, immunofluorescence microscopy revealed a loss of LRP6 protein in T84 cells after treatment with IFN-γ for 72 hours. Scale bar, 50μm. Lower panels, DSS challenge in vivo for 7 days resulted in a loss of LRP6 from the apical and lateral membrane of colonic enterocytes. Arrows highlight nuclear LRP6 staining. Scale bar, 20μm. (C) Loss of LRP6 after DSS treatment was confirmed by immunoblot of mucosal epithelial cells. Additionally, inflammation increased the activity of AKT and β-catenin. Samples were taken from two animals per group. (D) LRP6 was targeted in Caco-2 cells using specific siRNA. Loss of LRP6 caused a substantial drop in cell proliferation, as indicated by EdU incorporation for 1 hour. (E) β-catenin transcriptional activation was assessed using a TOPflash assay in SK-CO15 intestinal epithelial cells. Cells were treated as indicated for 24 hours. (F) Immunoblot analysis revealed no effect of IL-6 and IL-22 on Wnt and AKT signaling after 24 hours of treatment. Blots are representative of three experiments. (G) Temporal regulation of enterocyte proliferation during DSS colitis was determined by BrdU incorporation for 1 hour. Corresponding H&E stainings demonstrate the severity of colitis. The lowest number of BrdU-positive epithelial cells was observed on day 4. Images are representative of three animals per time point. Scale bars, 200μm. Data in all graphs in this figure are represented as mean ± s.e.m. * P < 0.01 vs control (Student’s t-test); † P < 0.05, ‡ P = 0.06 vs control (ANOVA with Dunnett’s post-test). For additional information please see also Figure S2 in the supplemental material.

