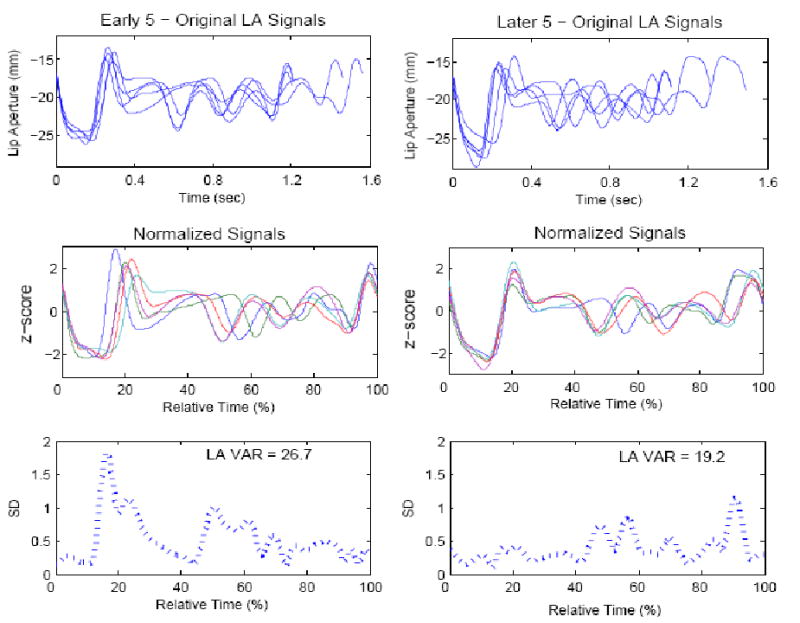
Figure 1.

Example of one nonword, “mabfieshabe,” produced by an adult who stutters. The plots in the left column are the set of 5 productions from the “early” trials; right column plots are the set of five “later” trials. Top panel: original difference signals before normalization. Note different duration of the various productions of the nonword. Middle panel: plots after time and amplitude normalization. Bottom panel: Standard deviations computed at 2% intervals in relative time. Inset in bottom plots are the lip aperture variability indices for the early and later trials. Note that the LA variability index is reduced for the later set of trials.
