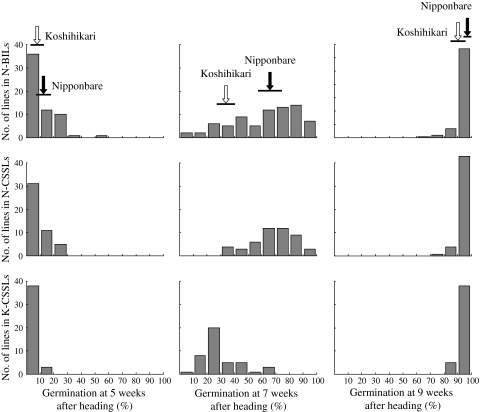
Fig. 2.
Frequency distributions for germination percentages at 5, 7 and 9 weeks after heading in 2008 in 79 of the Nipponbare/Koshihikari//Nipponbare backcrossed inbred lines (N-BILs), 48 of the Nipponbare/Koshihikari/////Nipponbare chromosome segment substitution lines (N-CSSLs) and 41 of the Nipponbare/Koshihikari/////Koshihikari chromosome segment substitution lines (K-CSSLs). Black and white arrows indicate the mean values for Nipponbare and Koshihikari, respectively. Horizontal lines under the arrows indicate the standard deviations

